
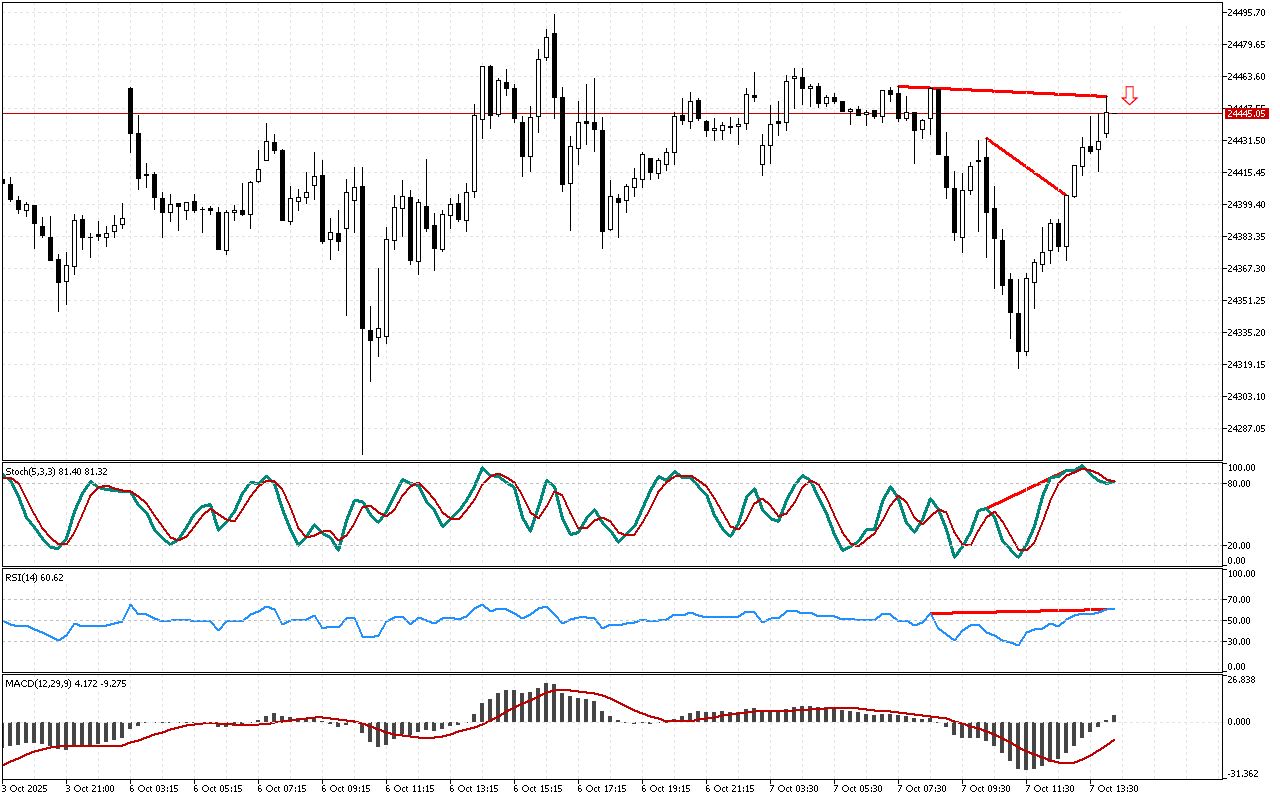
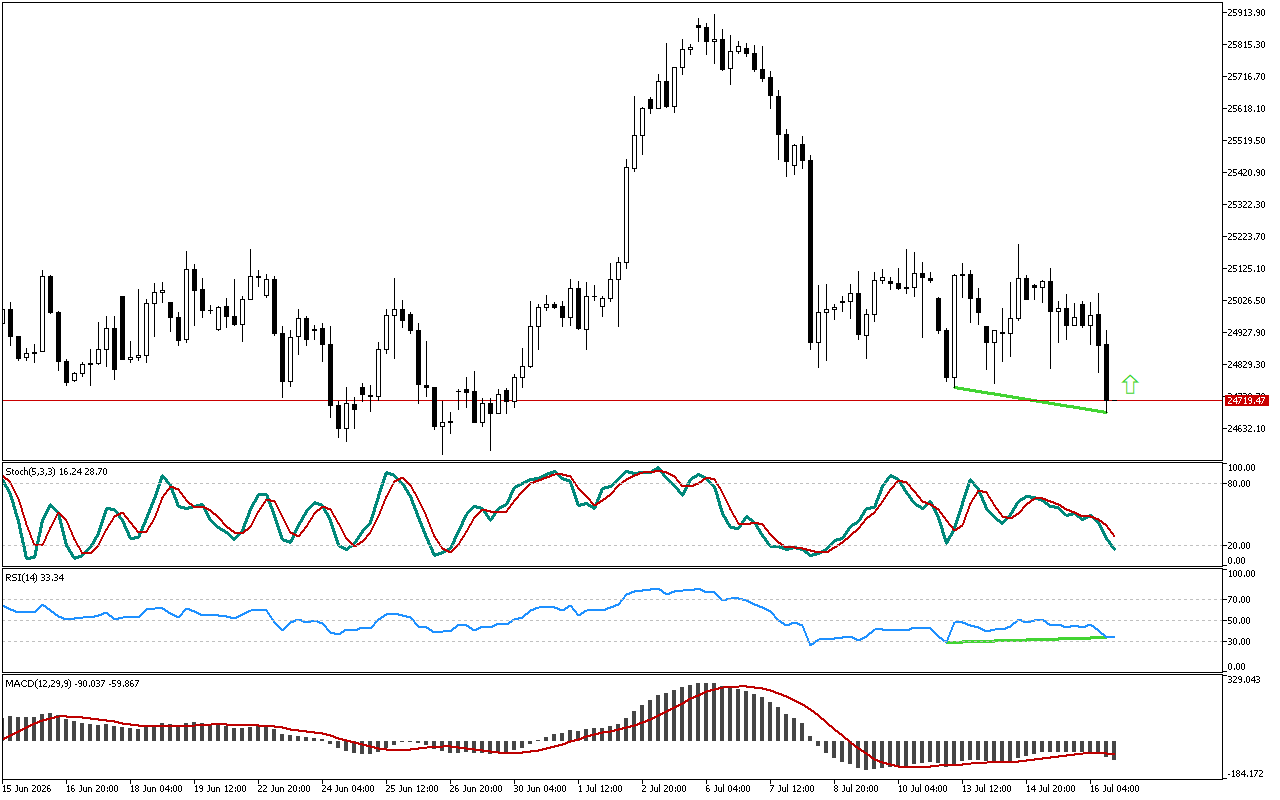
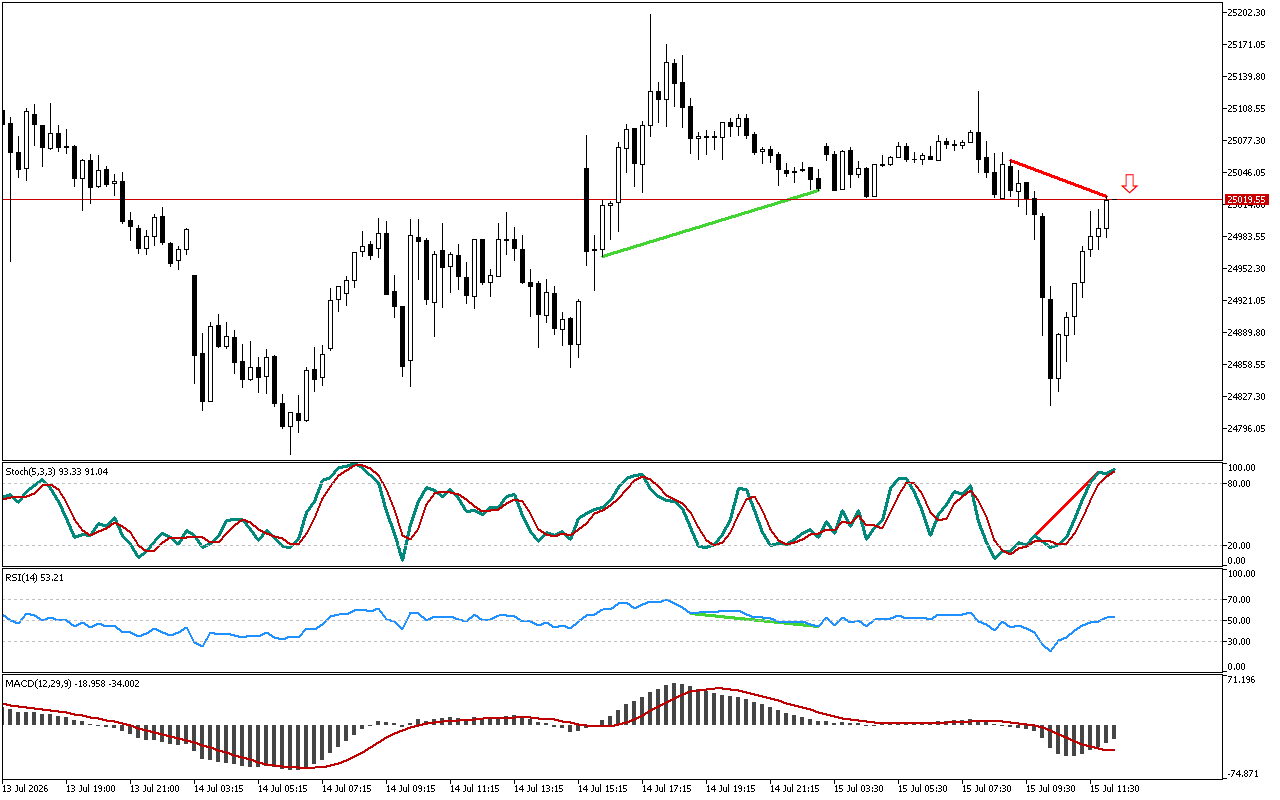
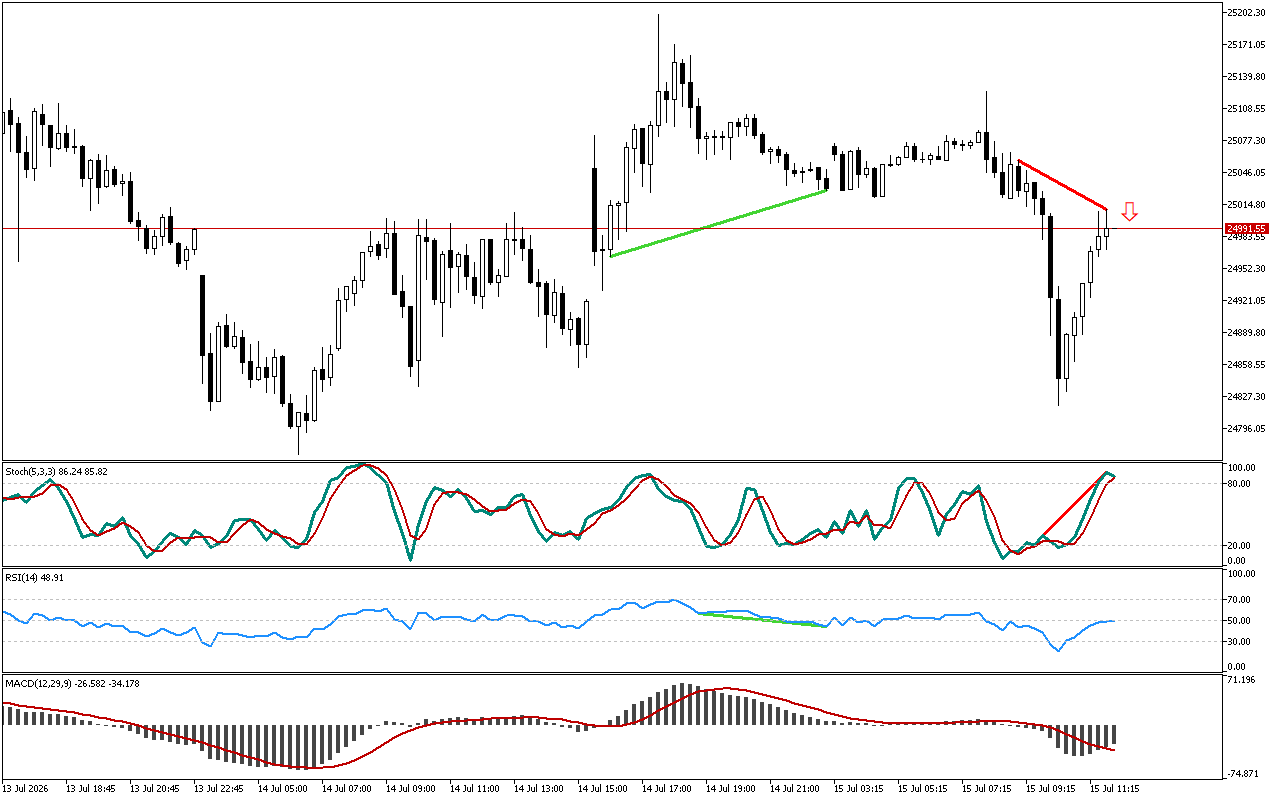
The RSI oscillator detects a discrepancy. The price failed to reach a new peak, while the RSI indicator rose above the previous intraday high, indicating a potential change in price movement dynamics.
The reversal signal was also recorded previously on the Stochastic indicator. Thus, the several reversal patterns at ones are noted on the chart. It increases the probability of the formation of a reversal scenario.
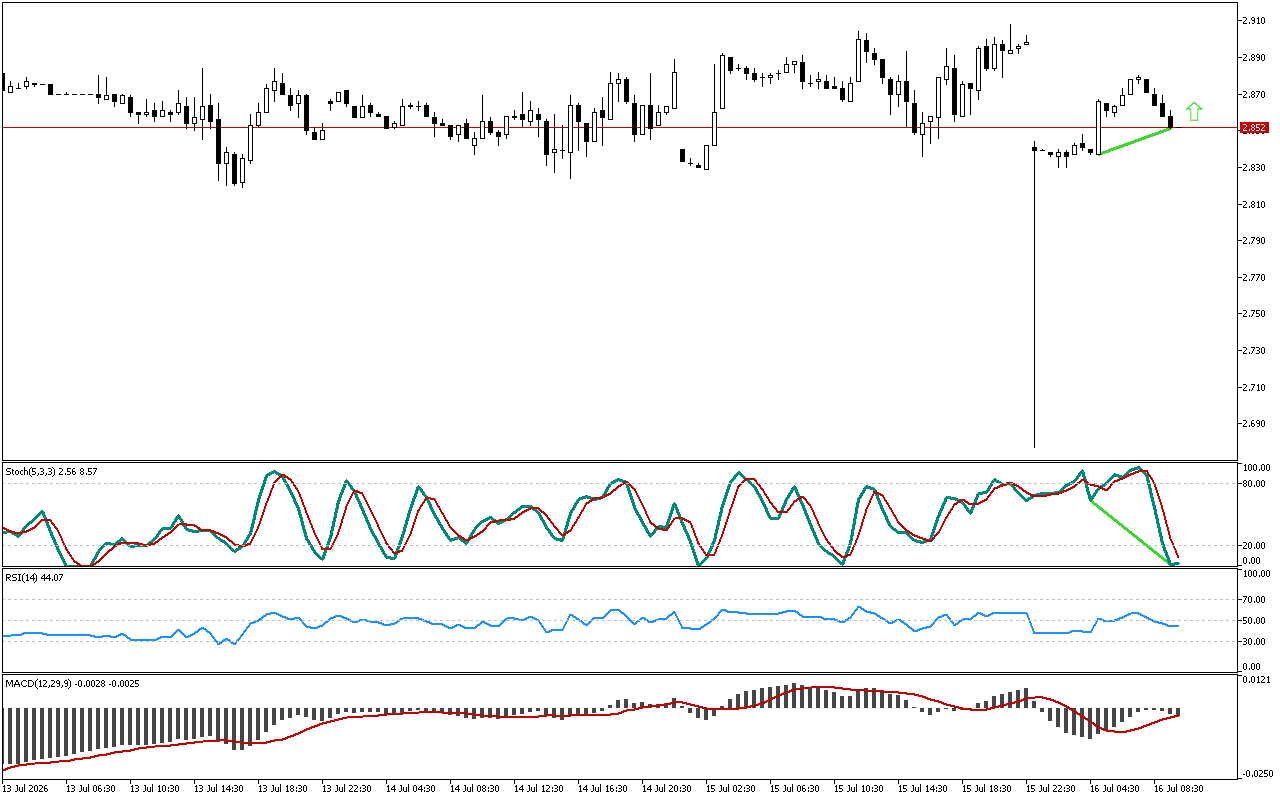
The histogram of the MACD indicator remains above the signal line, indicating the local development of an upward movement. However, the indicator indications do not contradict the signal, marked on the chart.
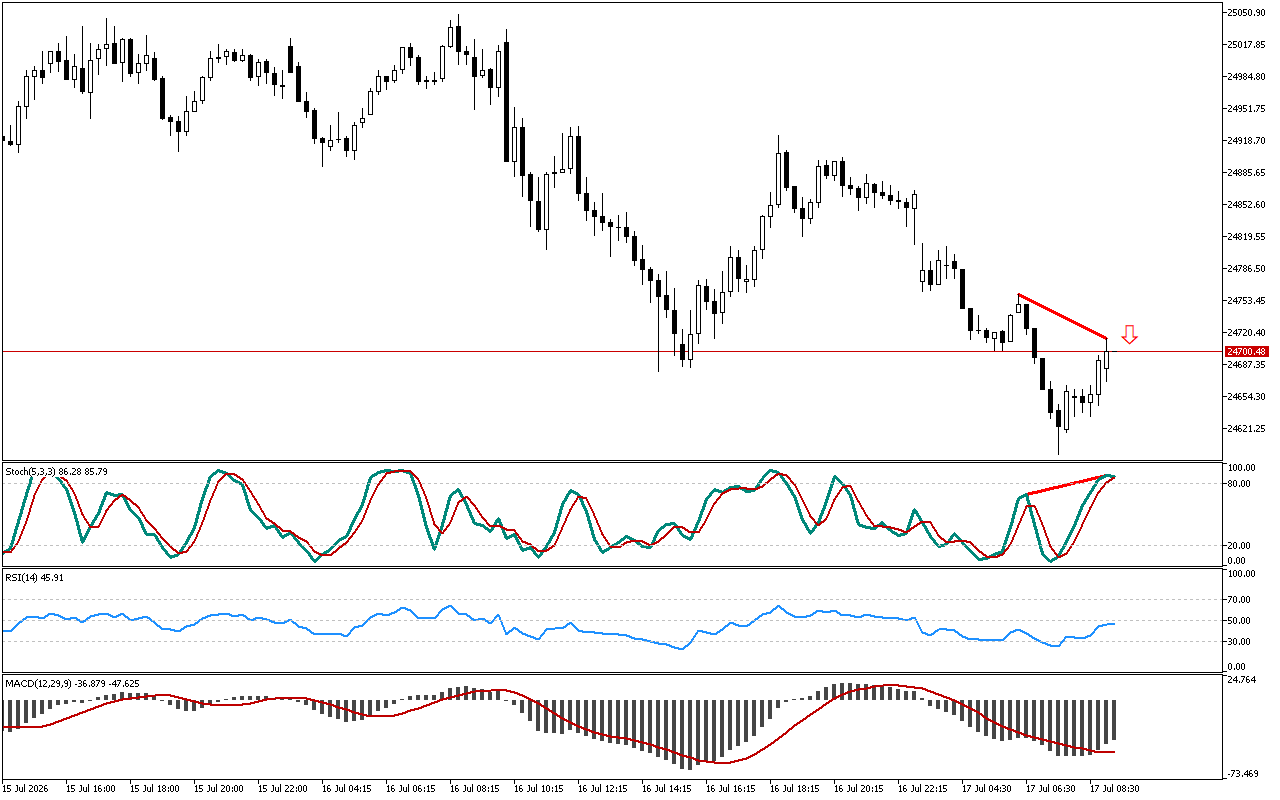
Short positions in respect to DAX 40 look more warranted strategically. More conservative traders may consider entering upon a retest of this level. With a more aggressive strategy, a trader can enter at or around the current prices.
📌 Entry: 24445.05
✔️ First target: 24317.05
✔️ Second target: 24233.75
❌ Stop order: 24516.15
DAX 40 M15: Divergence on RSI strengthens the previously received downward signal from Stochastic
Leave a Reply