
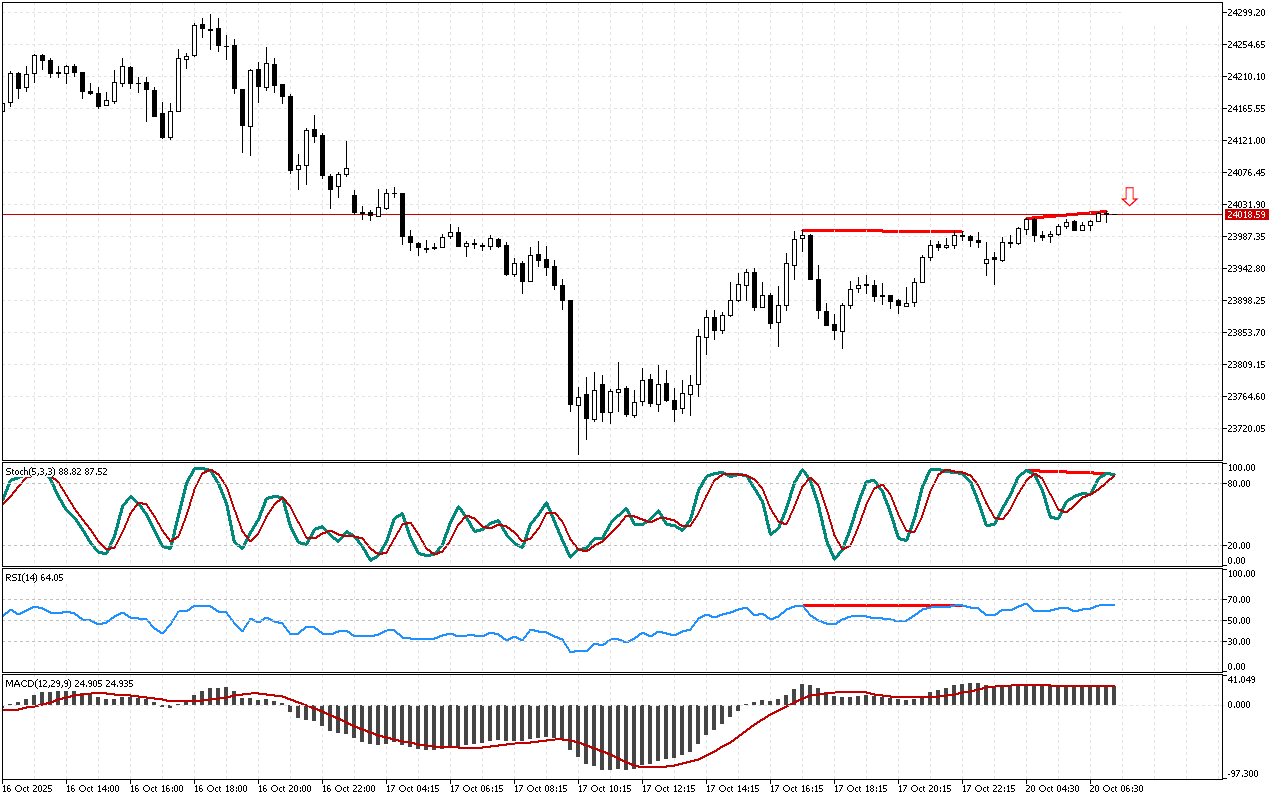
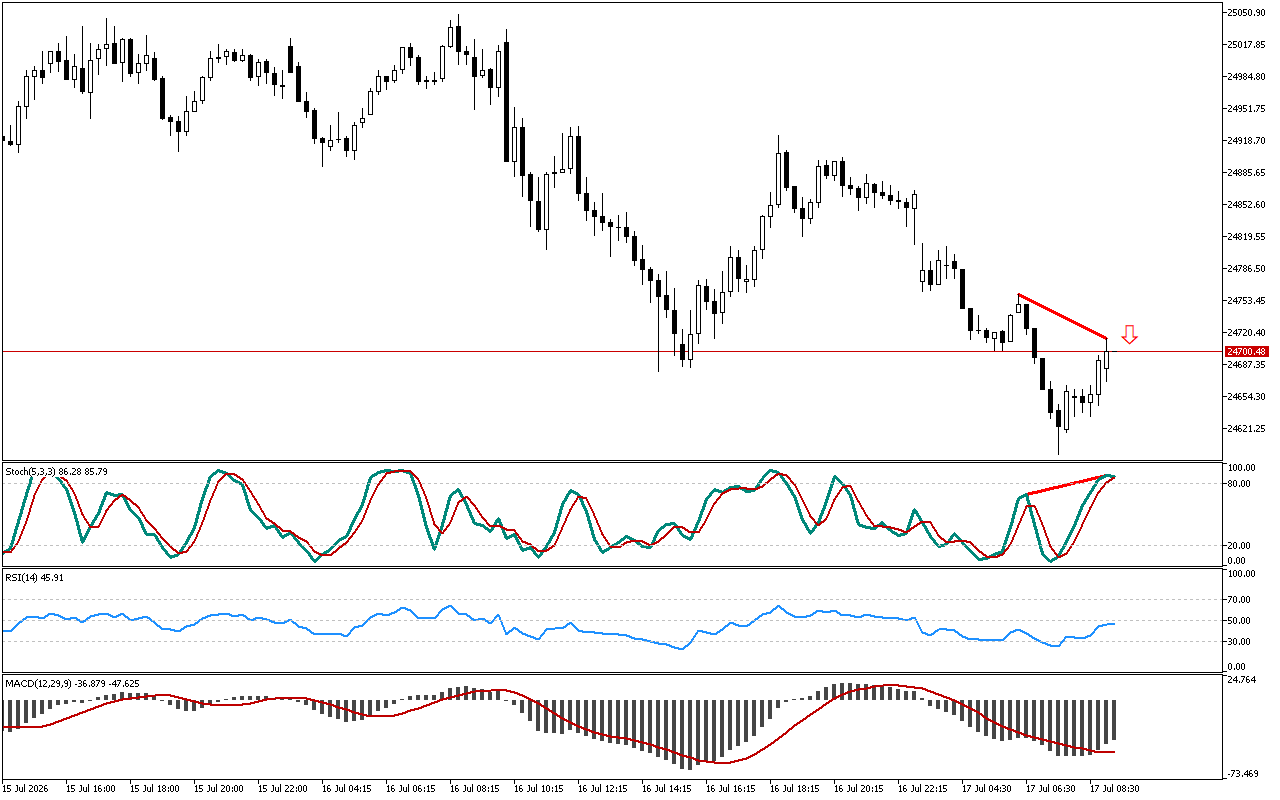
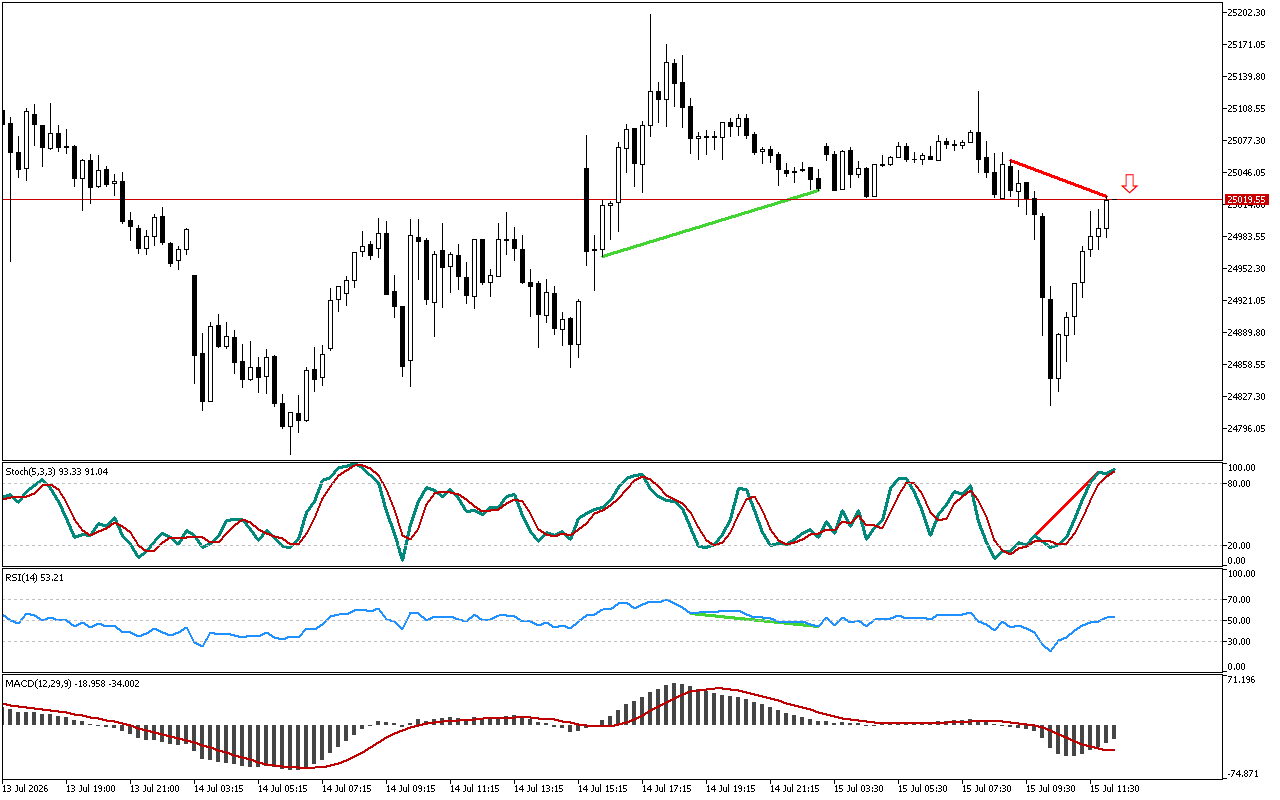
Let’s examine the Stochastic indicator. The oscillator shows the decay of the upward impulse along DAX 40. The price chart has updated the local maximum, but the Stochastic is declining. This divergence is marked with a red line.
The previously noted reversal signal is strengthened by the divergence, recorded on the RSI indicator. The appearance of divergences on various technical indicators increases the probability of a reversal scenario.
The histogram of the MACD indicator remains above the signal line, indicating the local development of an upward movement. However, the indicator indications do not contradict the signal, marked on the chart.
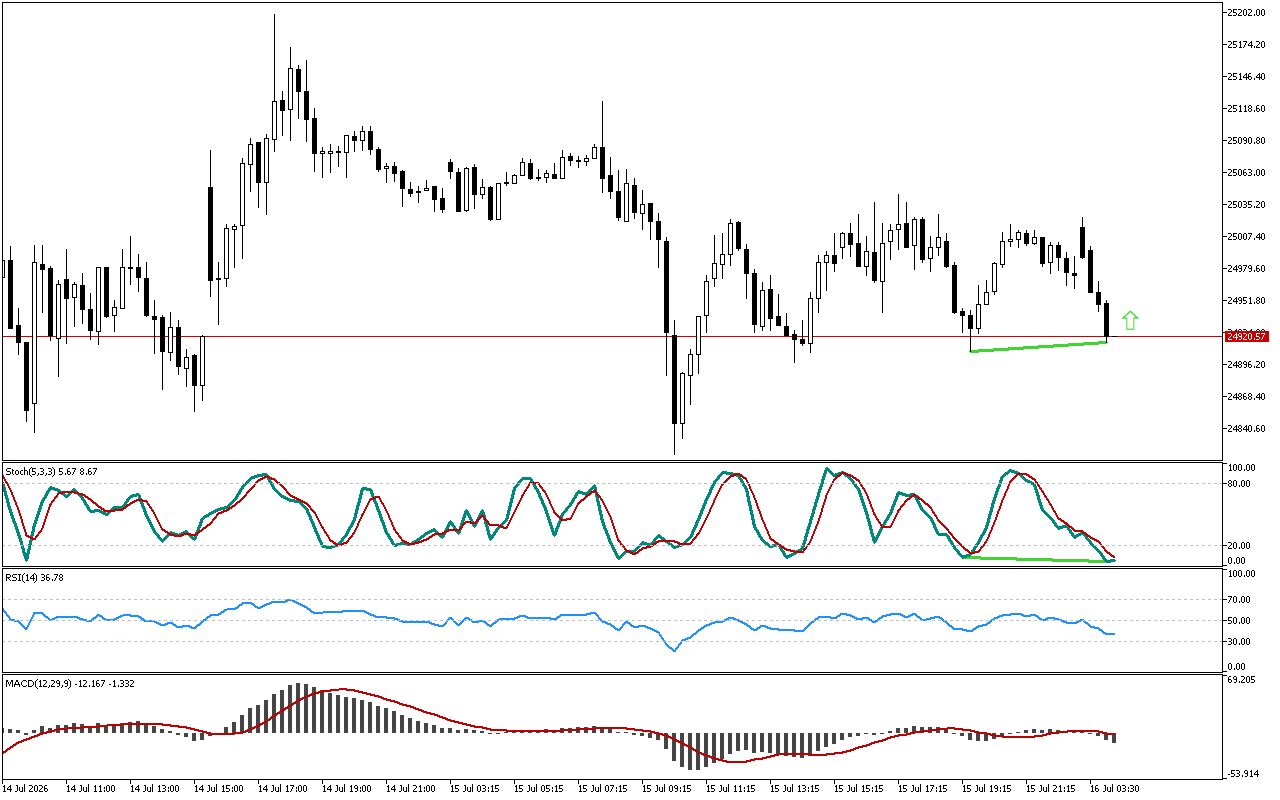
When it comes to DAX 40 short positions now look more preferable. For aggressive trading, a trader can enter the market at the current prices. Advocates of a more conservative strategy should wait for the level to be retested.
📌 Entry: 24018.59
✔️ First target: 23953.09
✔️ Second target: 23914.84
❌ Stop order: 24053.84
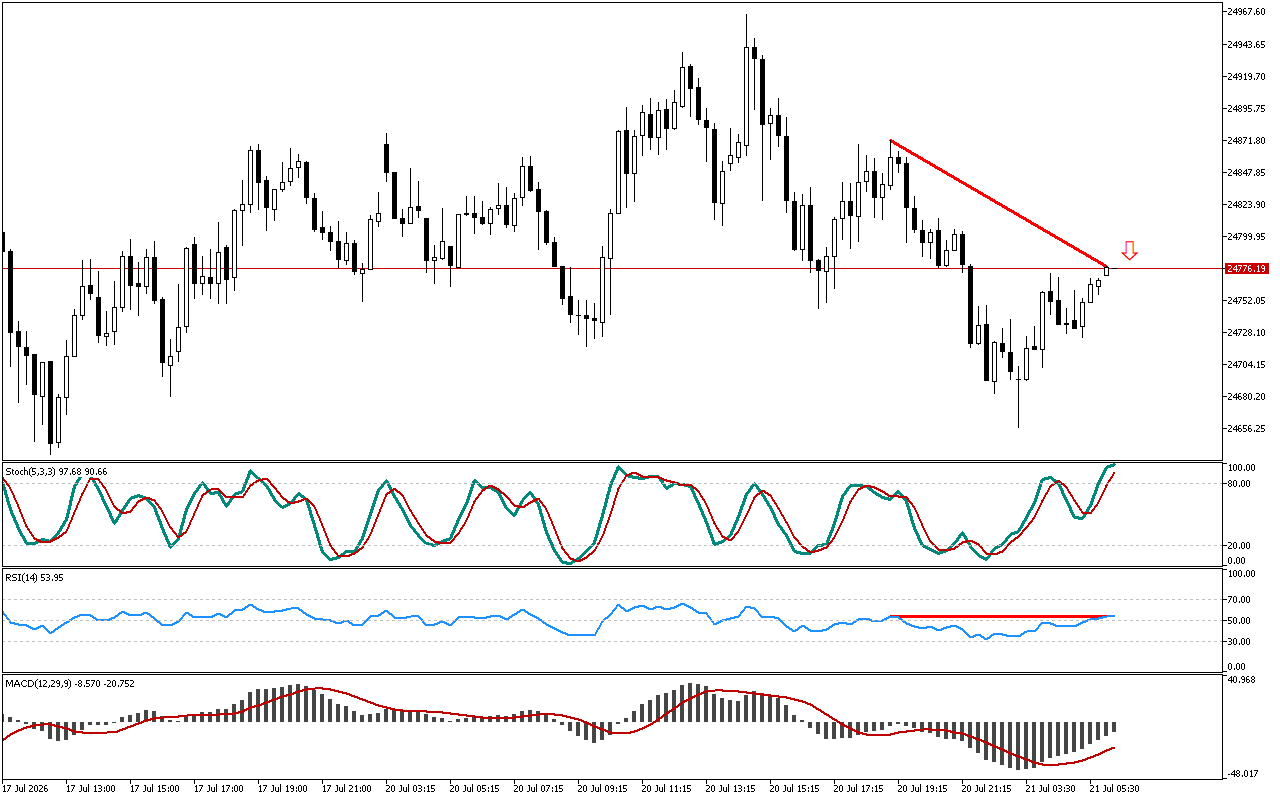
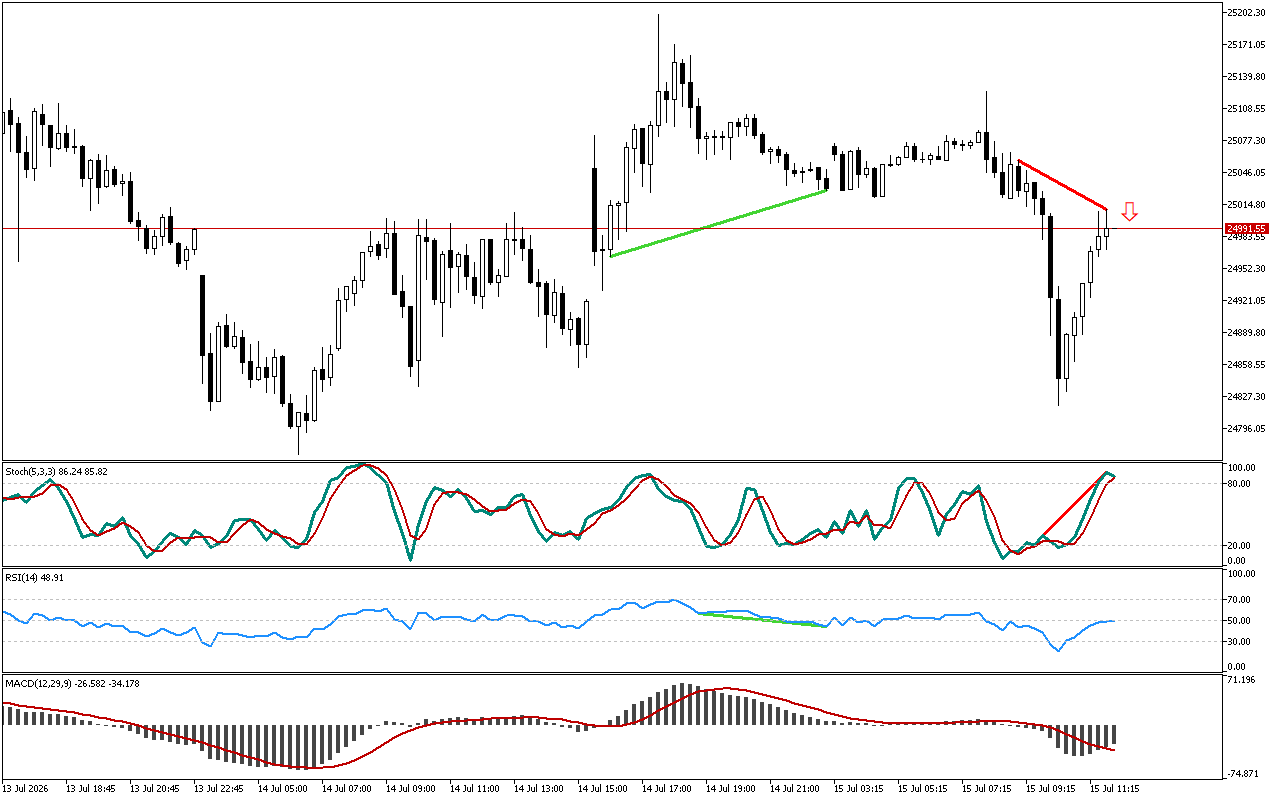
DAX 40 M15: There is also a downward divergence at the Stochastic after the RSI
Leave a Reply