
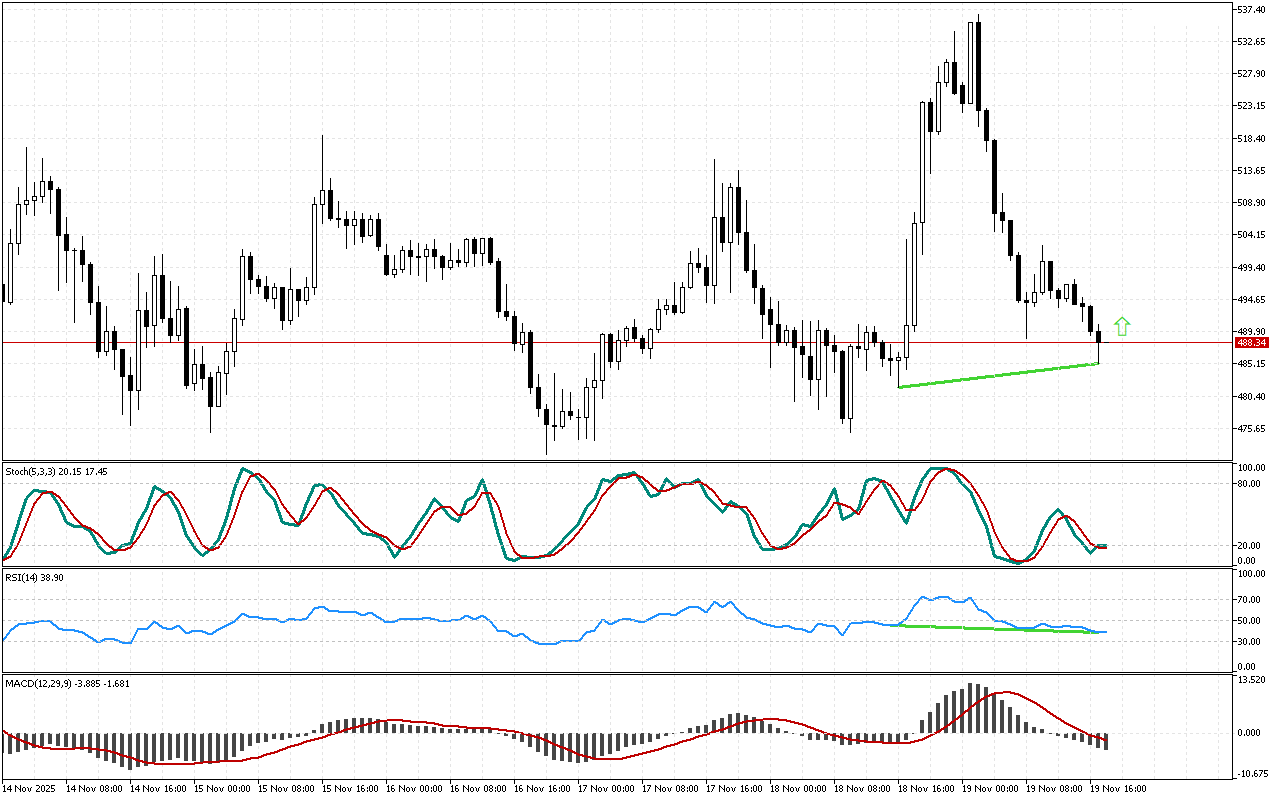
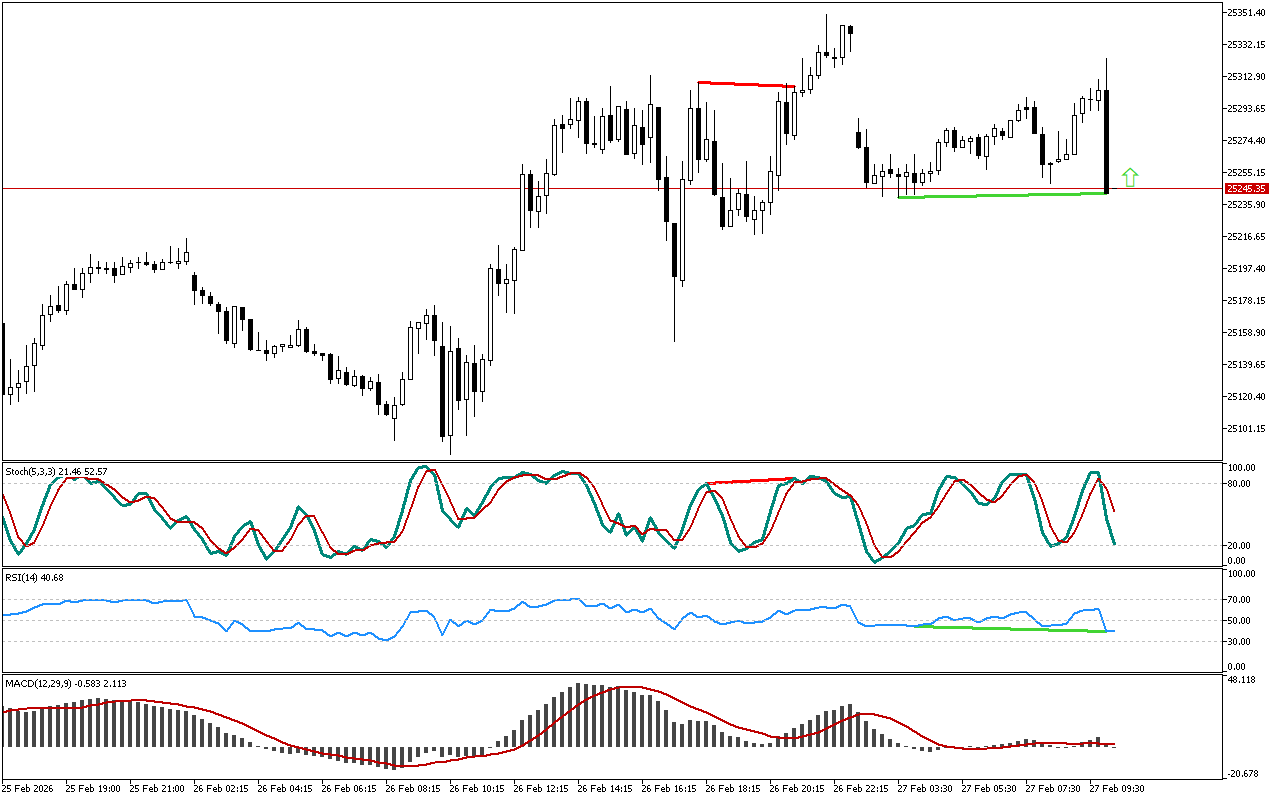
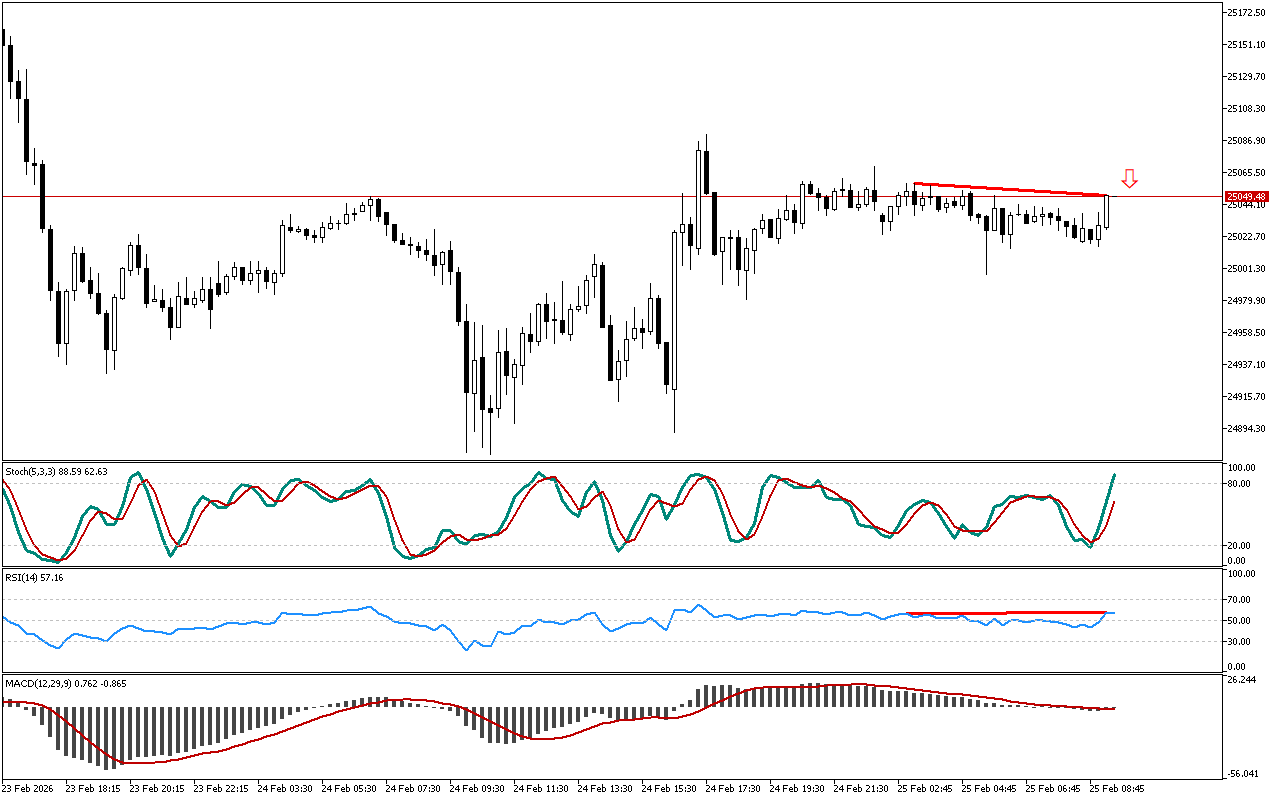
The price failed to reach a new low, while the RSI indicator shows an upward trend. The formed reverse divergence could signal a potential price reversal upward.
The MACD histogram is below the signal line. This indicator shows medium- and long-term trends and may ignore short-term price reversals and pullbacks sometimes.
There is the blue main line above the red signal line on the Stochastic indicator. The reversal pattern has not formed yet.
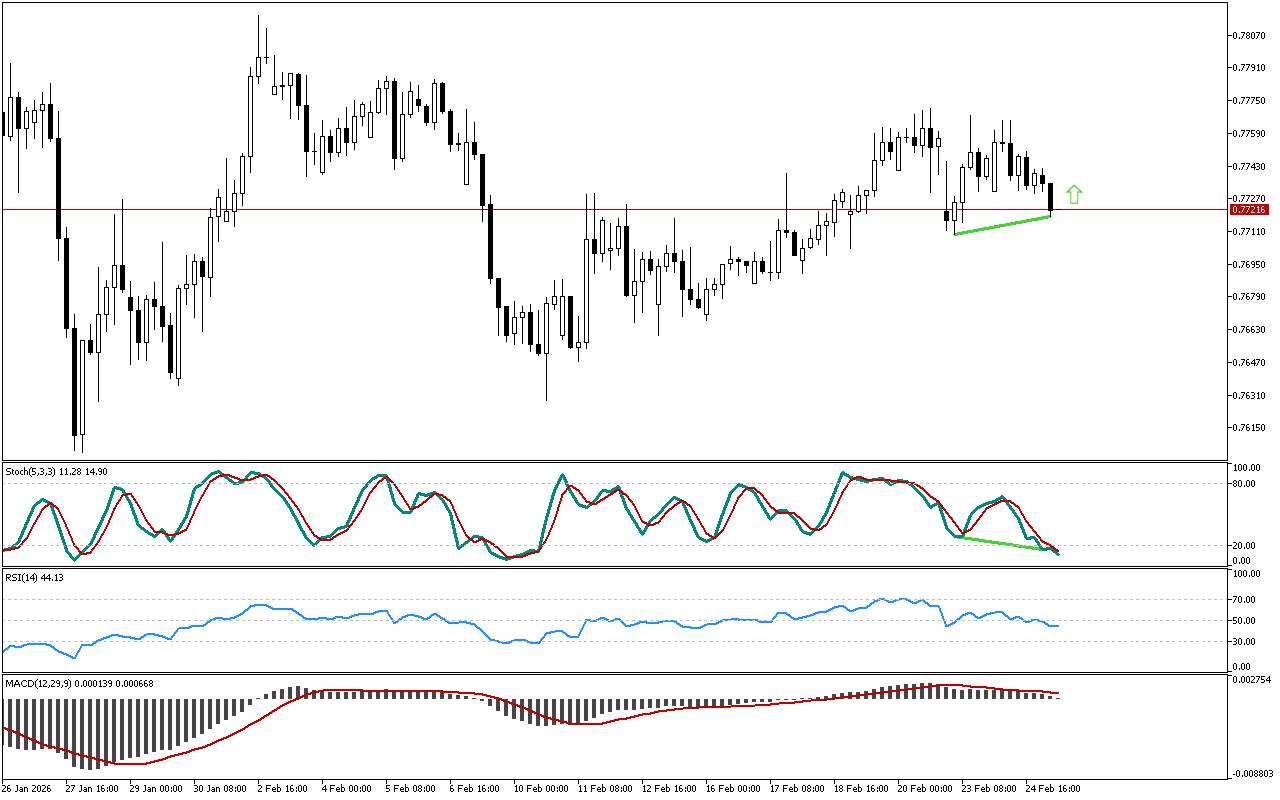
For Bit.Cash now the most evident trading strategy is opening the long positions. A trader can enter the market at the current levels or when a preset level is being retested.
📌 Entry: 488.34
✔️ First target: 536.57
✔️ Second target: 570.57
❌ Stop order: 460.85
Bit.Cash H1: RSI signals a possible upward reversal
Leave a Reply