
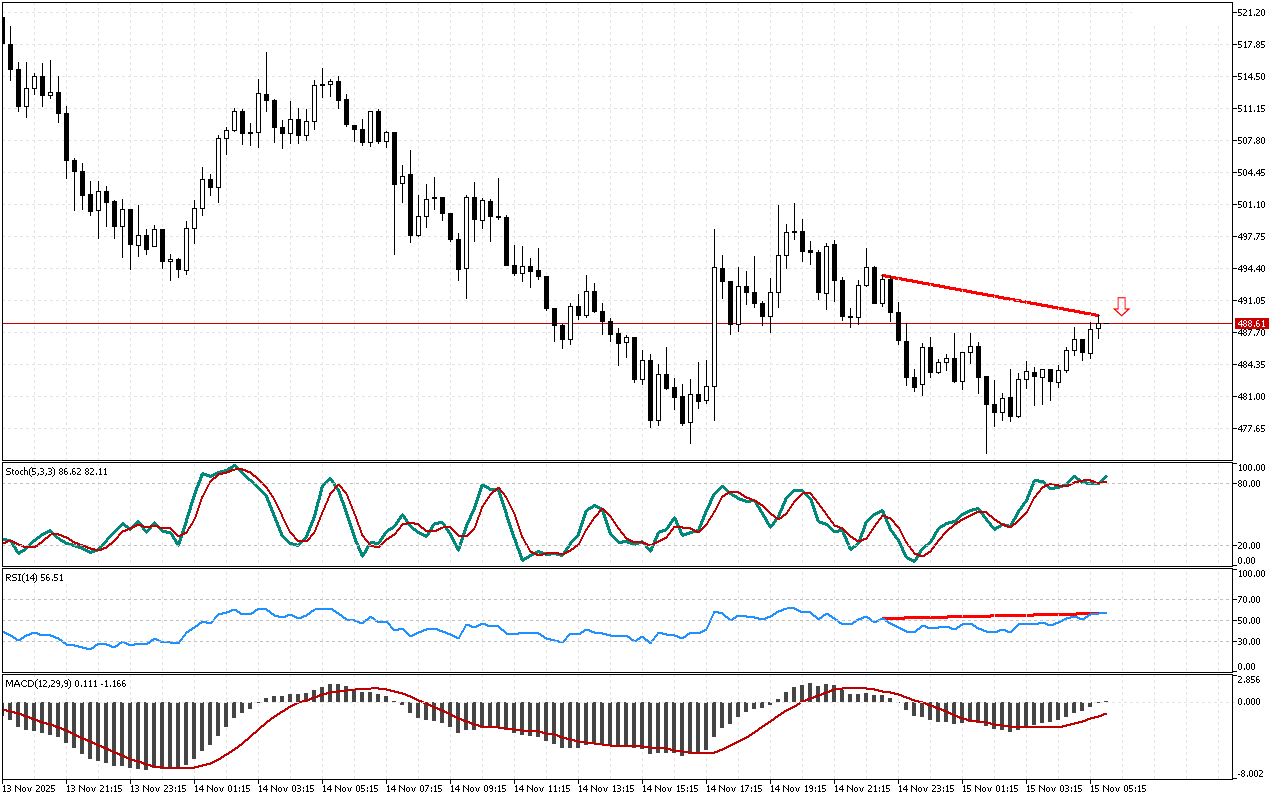
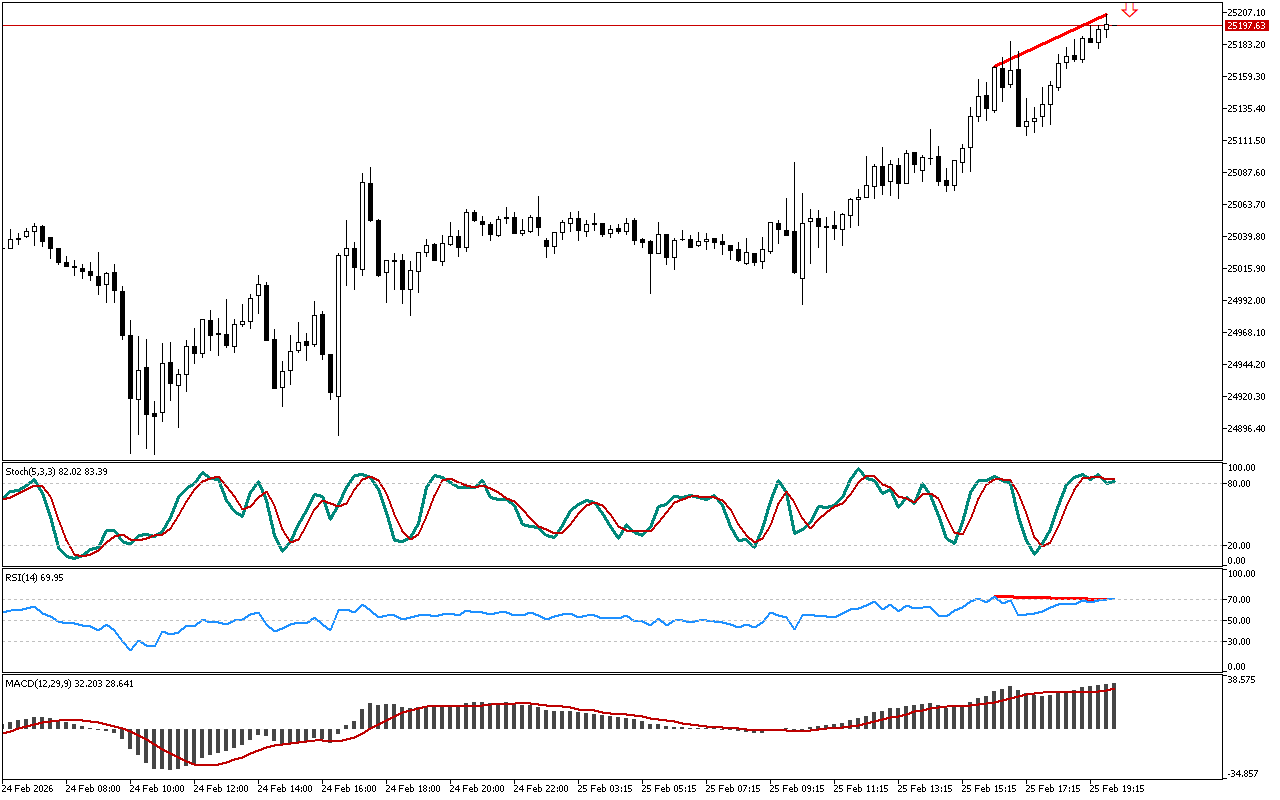
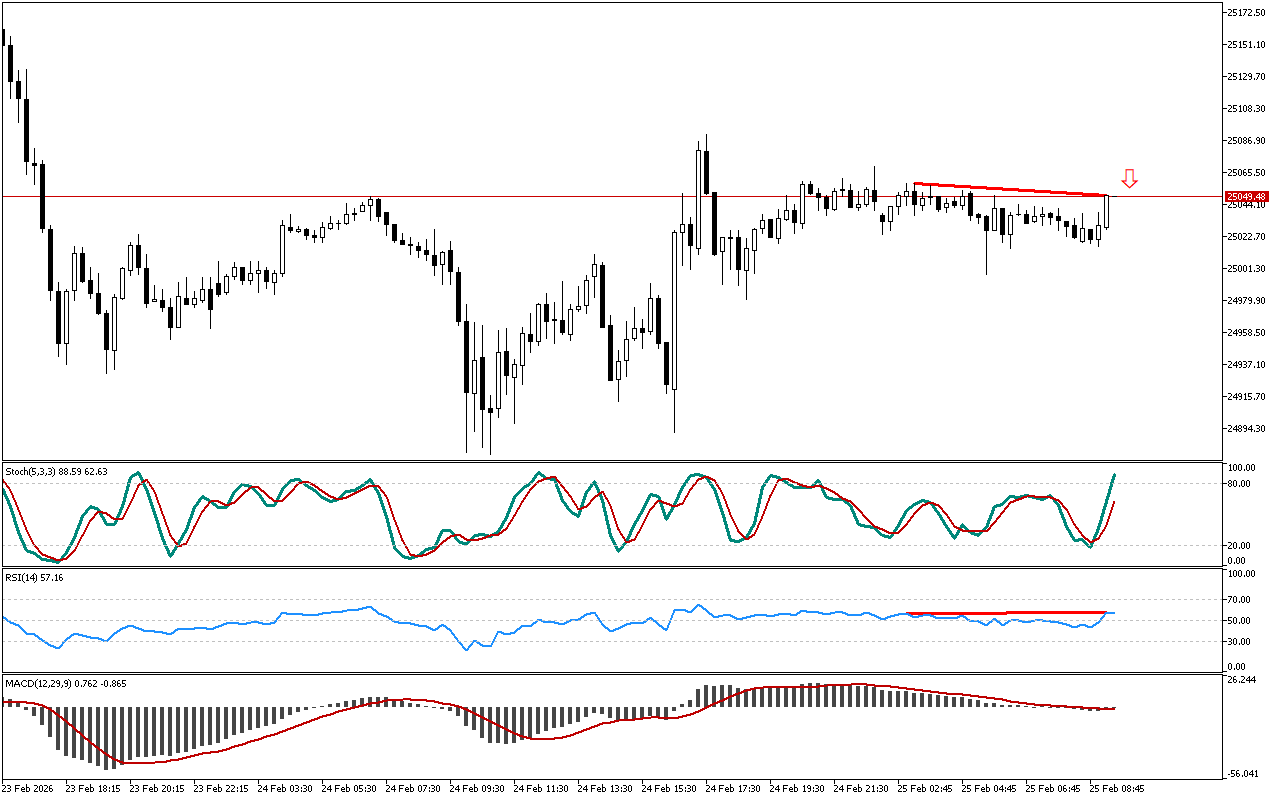
The RSI oscillator detects a discrepancy. The price failed to reach a new peak, while the RSI indicator rose above the previous intraday high, indicating a potential change in price movement dynamics.
The histogram of the MACD indicator remains above the signal line, indicating the local development of an upward movement. However, the indicator indications do not contradict the signal, marked on the chart.
On the Stochastic indicator, the blue main line remains below the signal red line. The current state of the indicator neither cancels nor contradicts signals received from other technical indicators.
When it comes to Bit.Cash short positions now look more preferable. For aggressive trading, a trader can enter the market at the current prices. Advocates of a more conservative strategy should wait for the level to be retested.
📌 Entry: 488.61
✔️ First target: 475.00
✔️ Second target: 460.74
❌ Stop order: 498.03
Bit.Cash M15: The downward divergence from RSI
Leave a Reply