
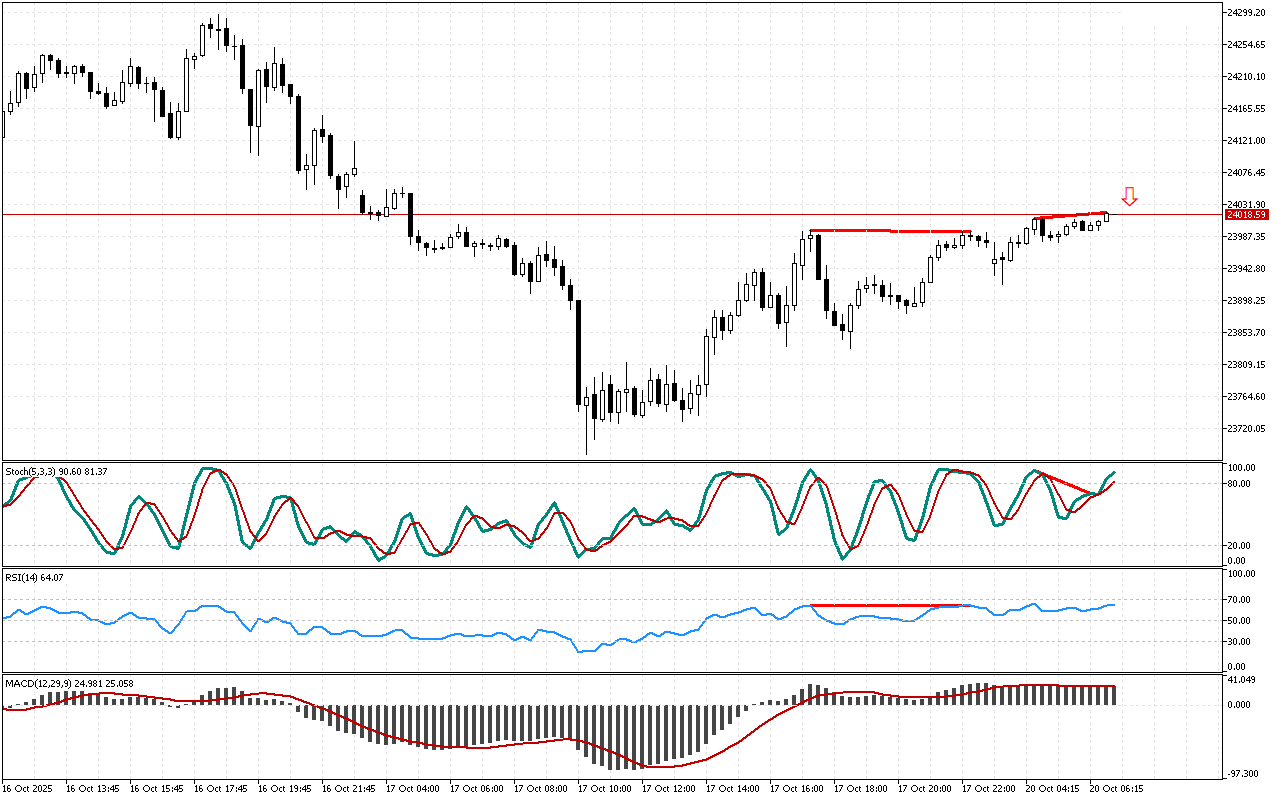
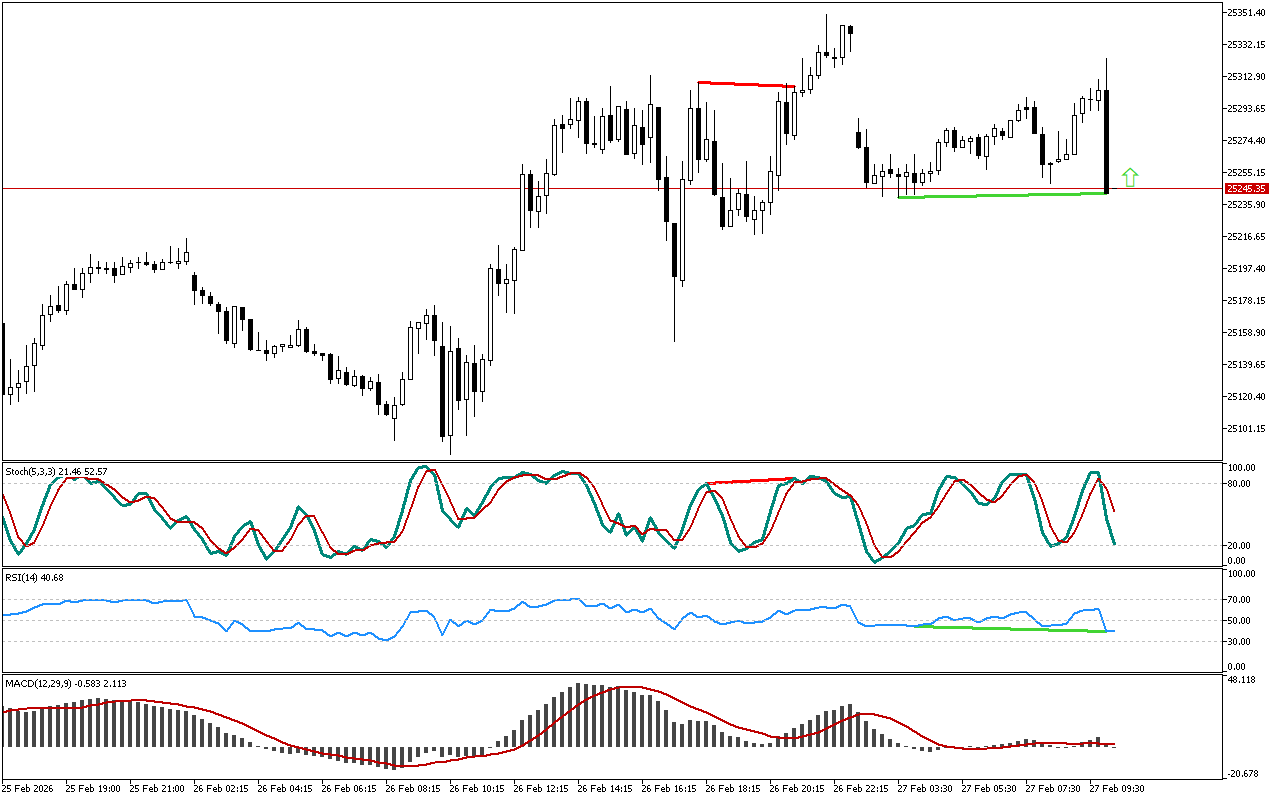
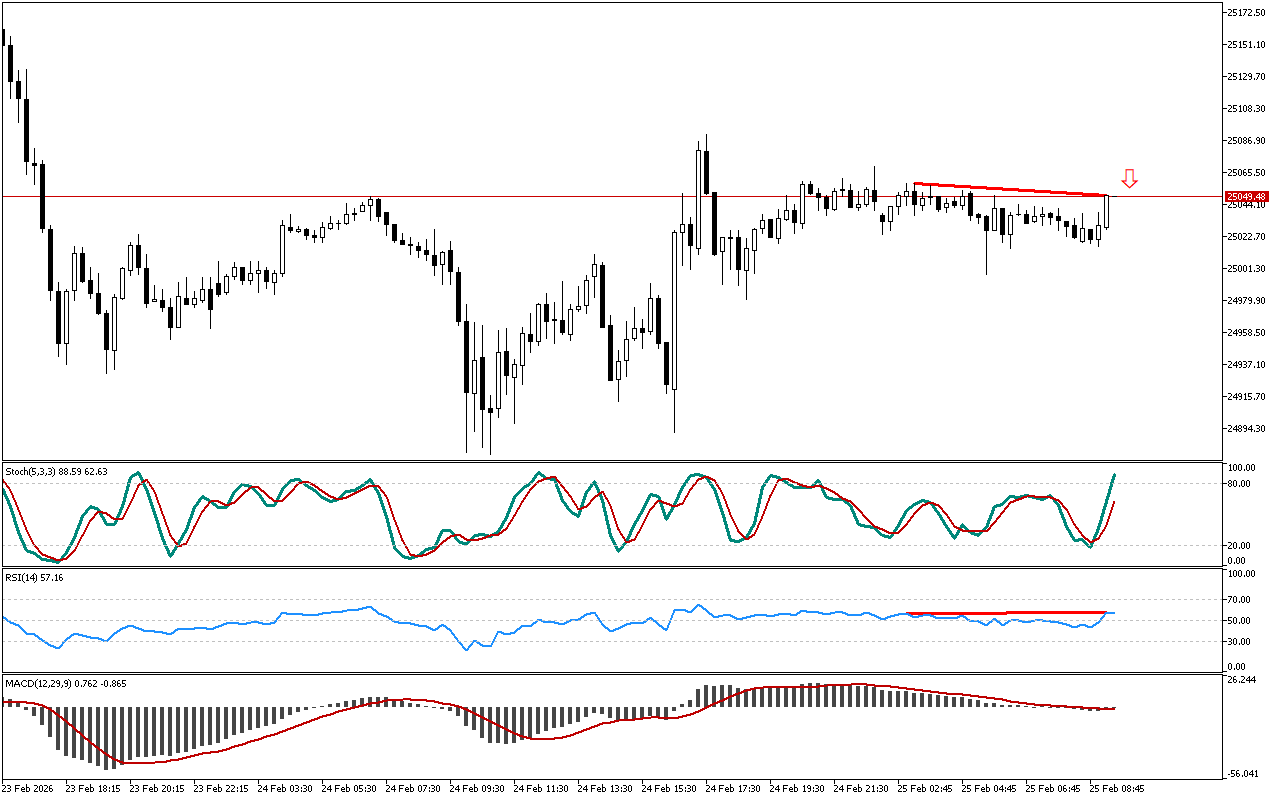
The price failed to form a new high, while the Stochastic indicator remains above the 20 level. This divergence, marked with a red line on the chart, indicates weakening of an upward momentum and increases the probability of a price decline.
The previously noted reversal signal is strengthened by the divergence, recorded on the RSI indicator. The appearance of divergences on various technical indicators increases the probability of a reversal scenario.
The MACD histogram is below the signal line. This indicator shows medium- and long-term trends and may ignore short-term price reversals and pullbacks sometimes.
Short positions in respect to DAX 40 look more warranted strategically. More conservative traders may consider entering upon a retest of this level. With a more aggressive strategy, a trader can enter at or around the current prices.
📌 Entry: 24018.59
✔️ First target: 23953.09
✔️ Second target: 23917.59
❌ Stop order: 24053.59
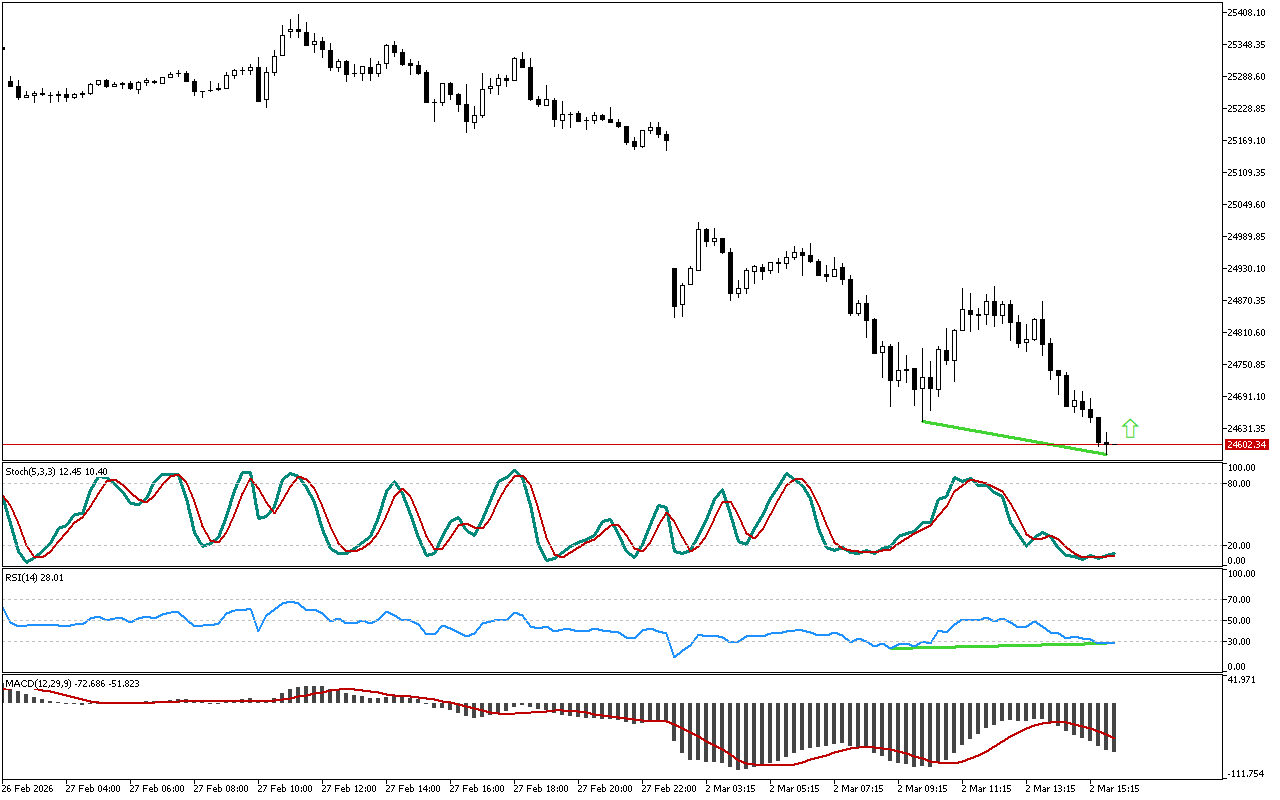
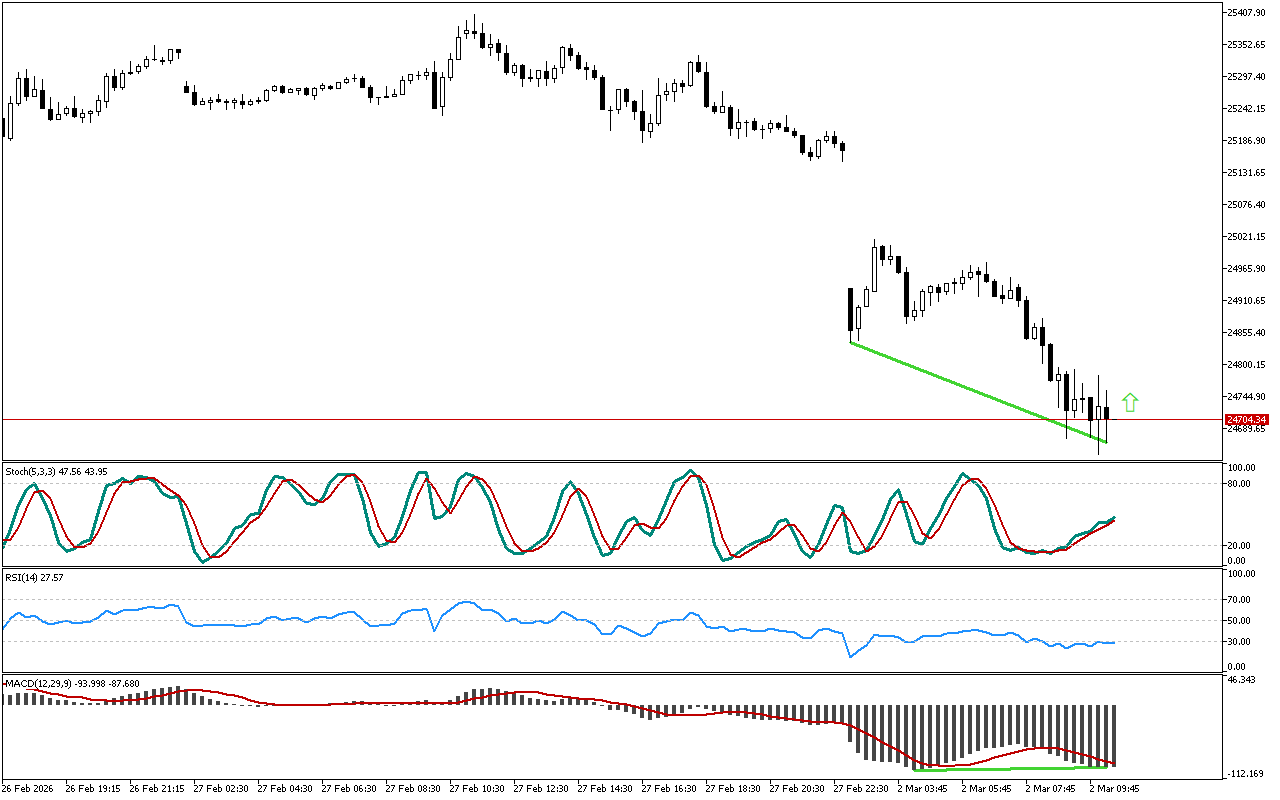
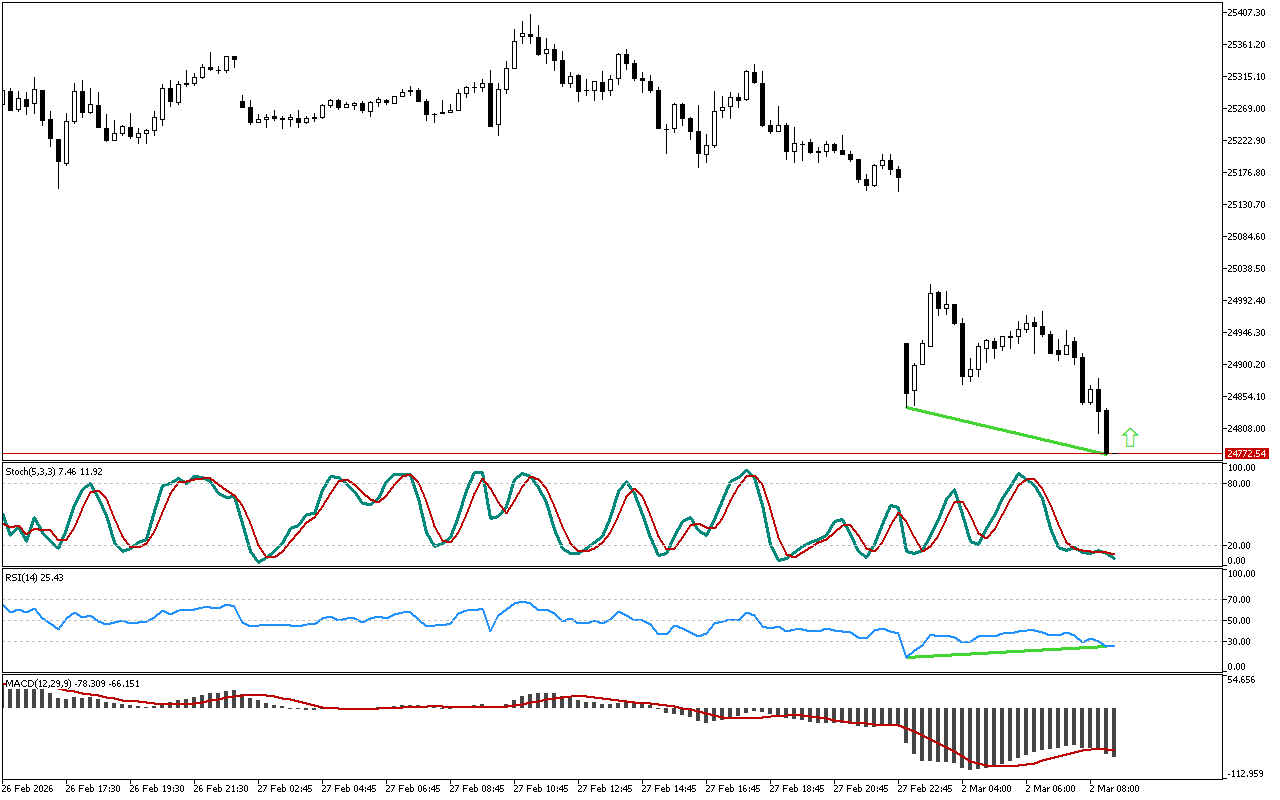
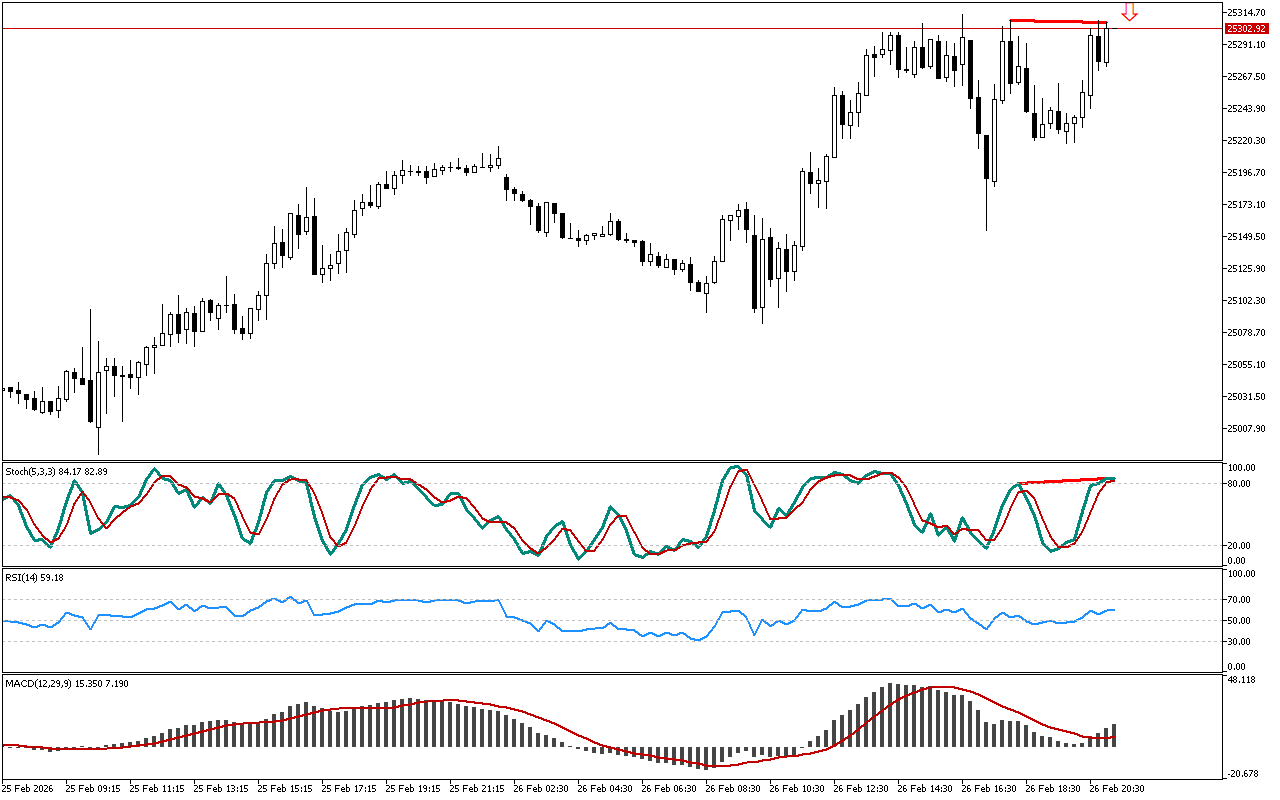
DAX 40 M15: There is also a downward divergence at the Stochastic after the RSI
Leave a Reply