
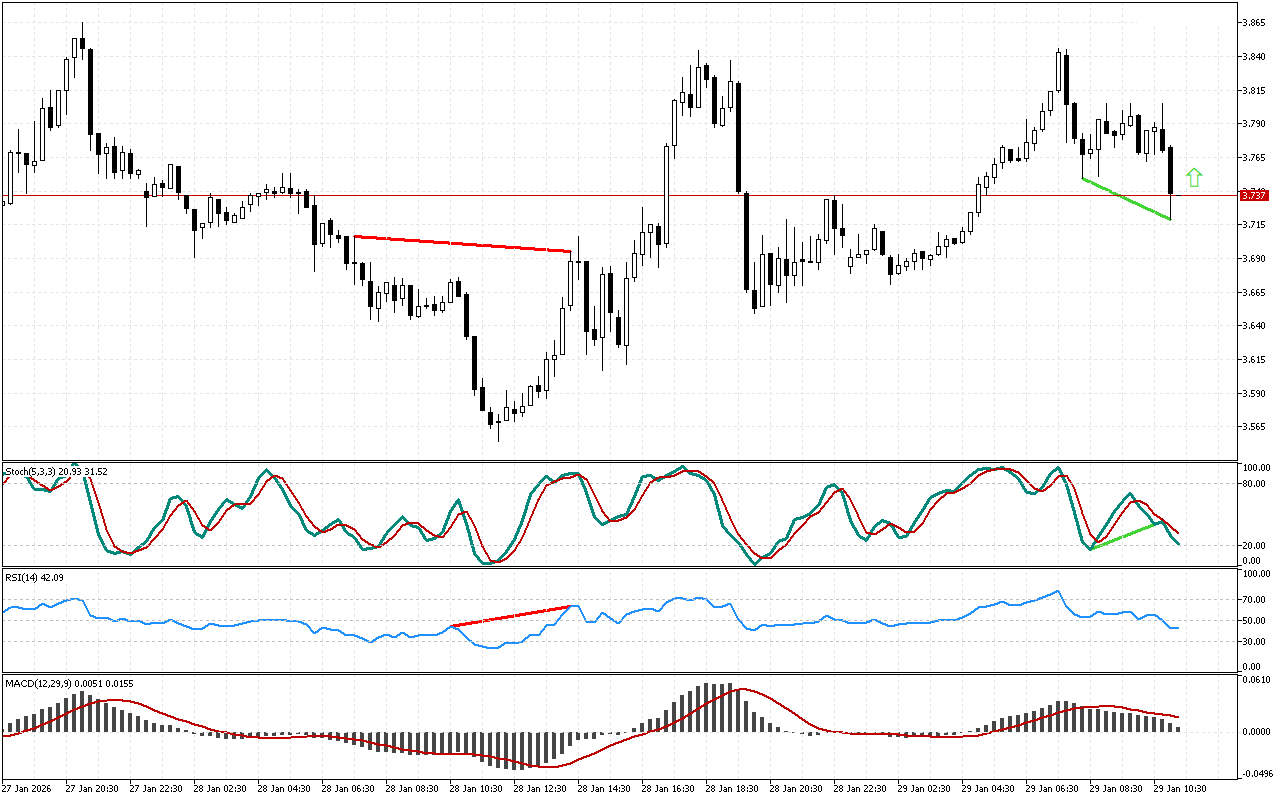
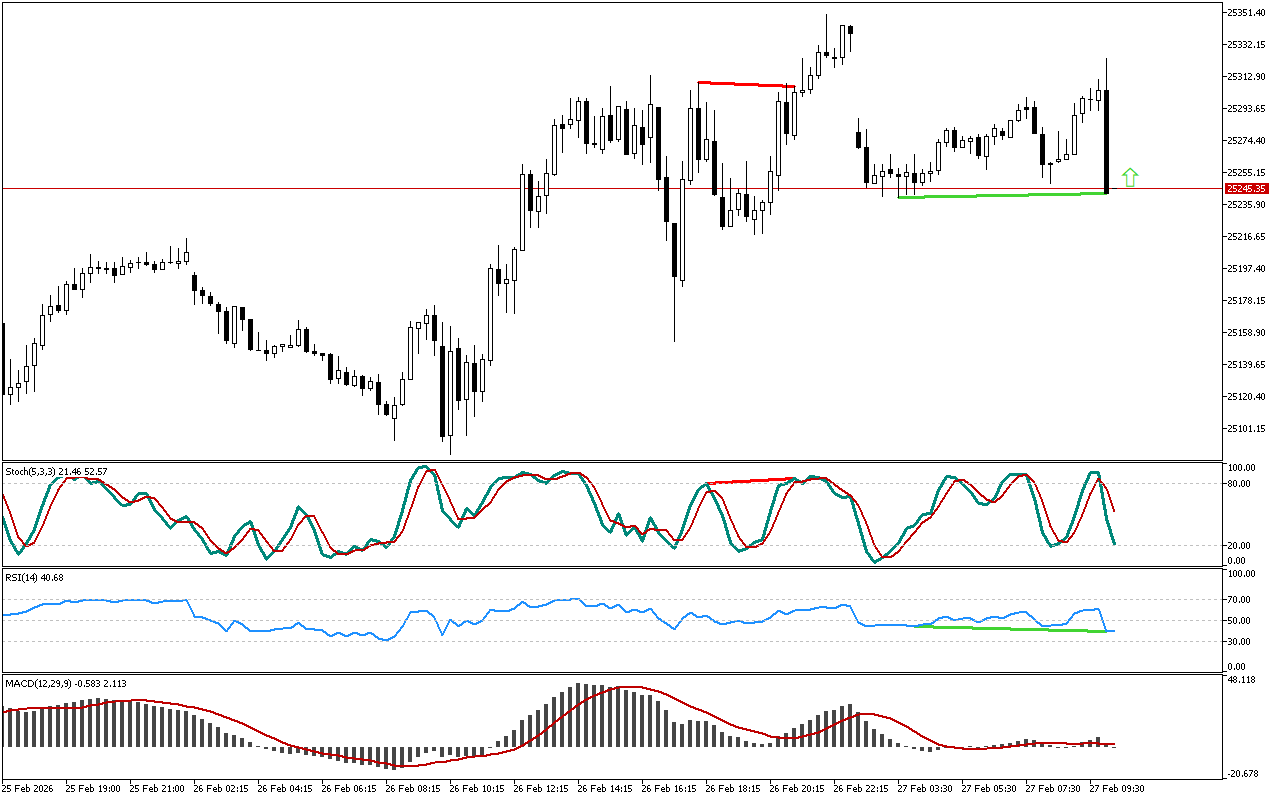
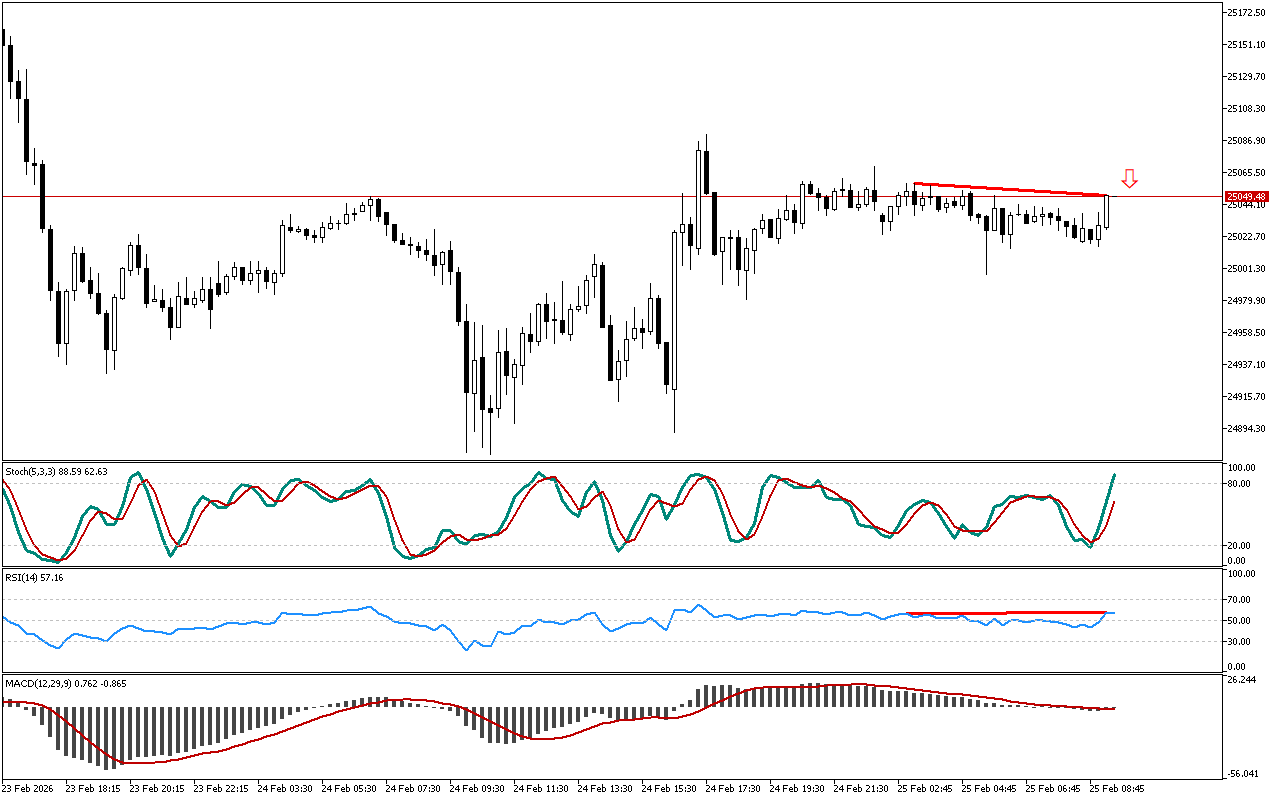
A divergence between the direction of price movement and Stochastic indicator has formed on the Natural Gas chart. Although the price is decreasing, Stochastic is directed upward, which is the first sign of easing pressure on the price.
The RSI indicator is now below the mark of 50. The position of the indicator below this level indicates the predominance of a downward trend.
The MACD histogram is below the signal line. This indicator shows medium- and long-term trends and may ignore short-term price reversals and pullbacks sometimes.
It is recommended to prioritize long positions on Natural Gas in the current situation. Entry points can be selected both at current prices and based on an outcome of a retest of the specified resistance level.
📌 Entry: 3.737
✔️ First target: 3.845
✔️ Second target: 3.927
❌ Stop order: 3.675
Natural Gas M15: Divergence signal is received from the Stochastic
Leave a Reply