
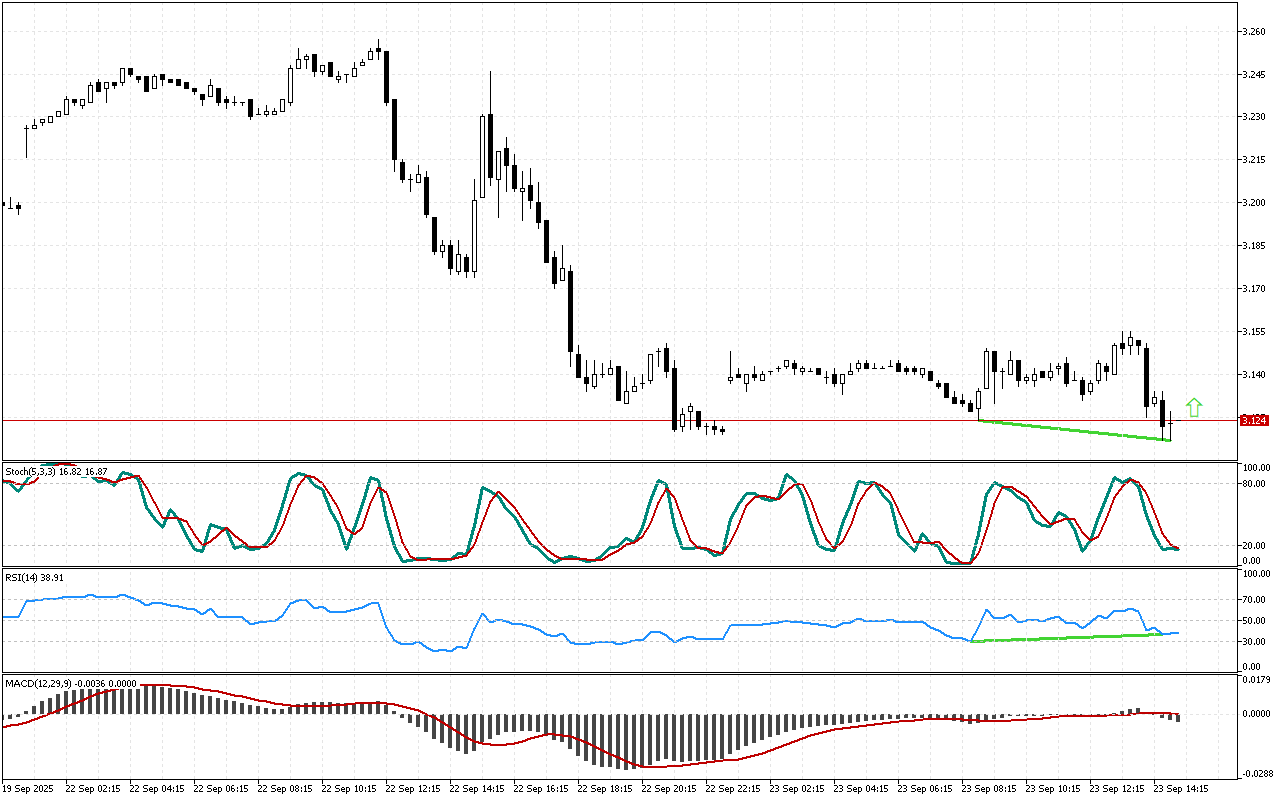
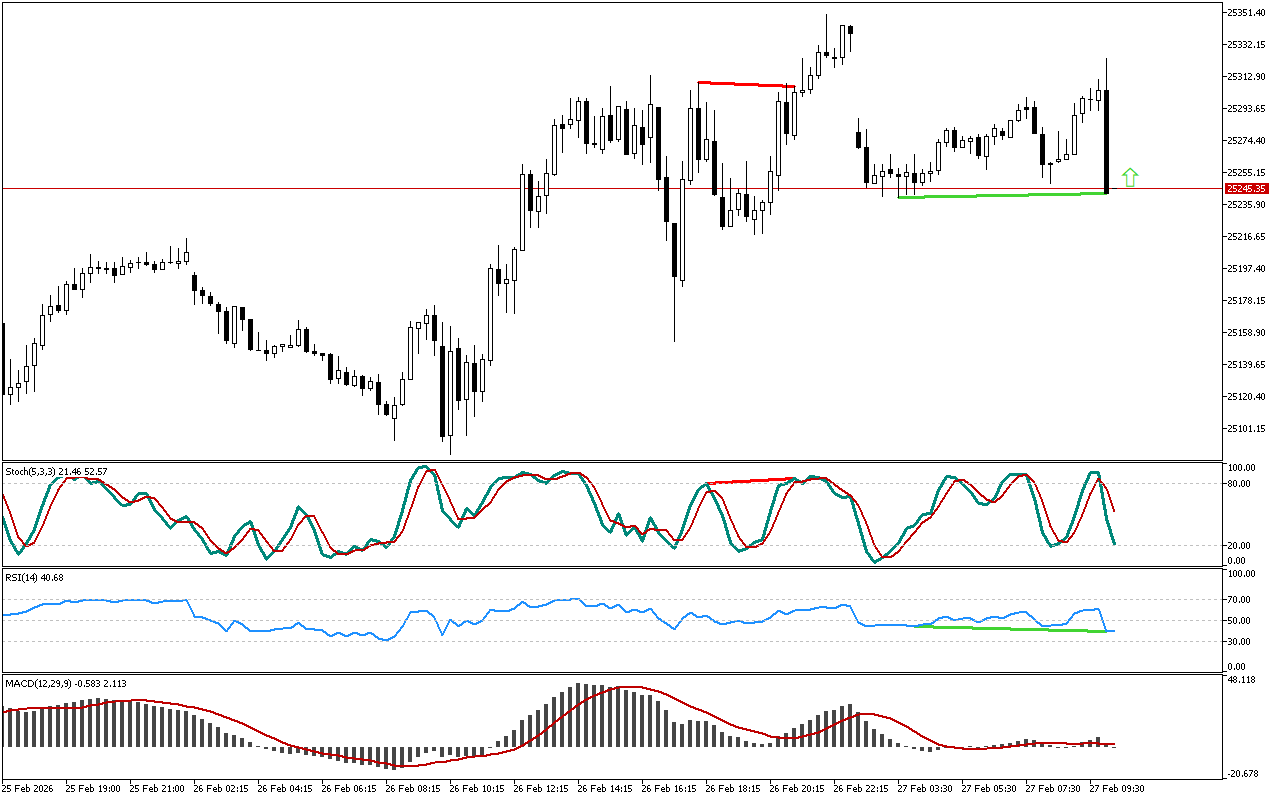
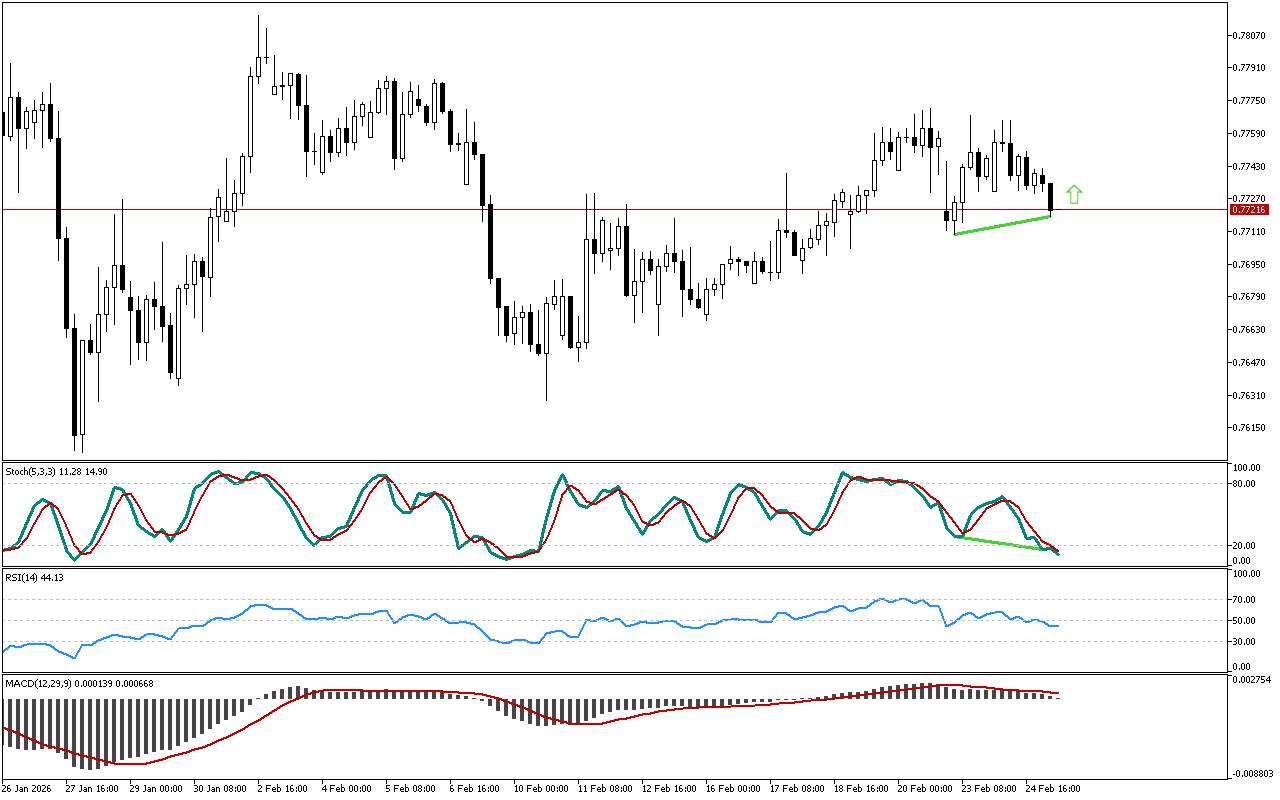
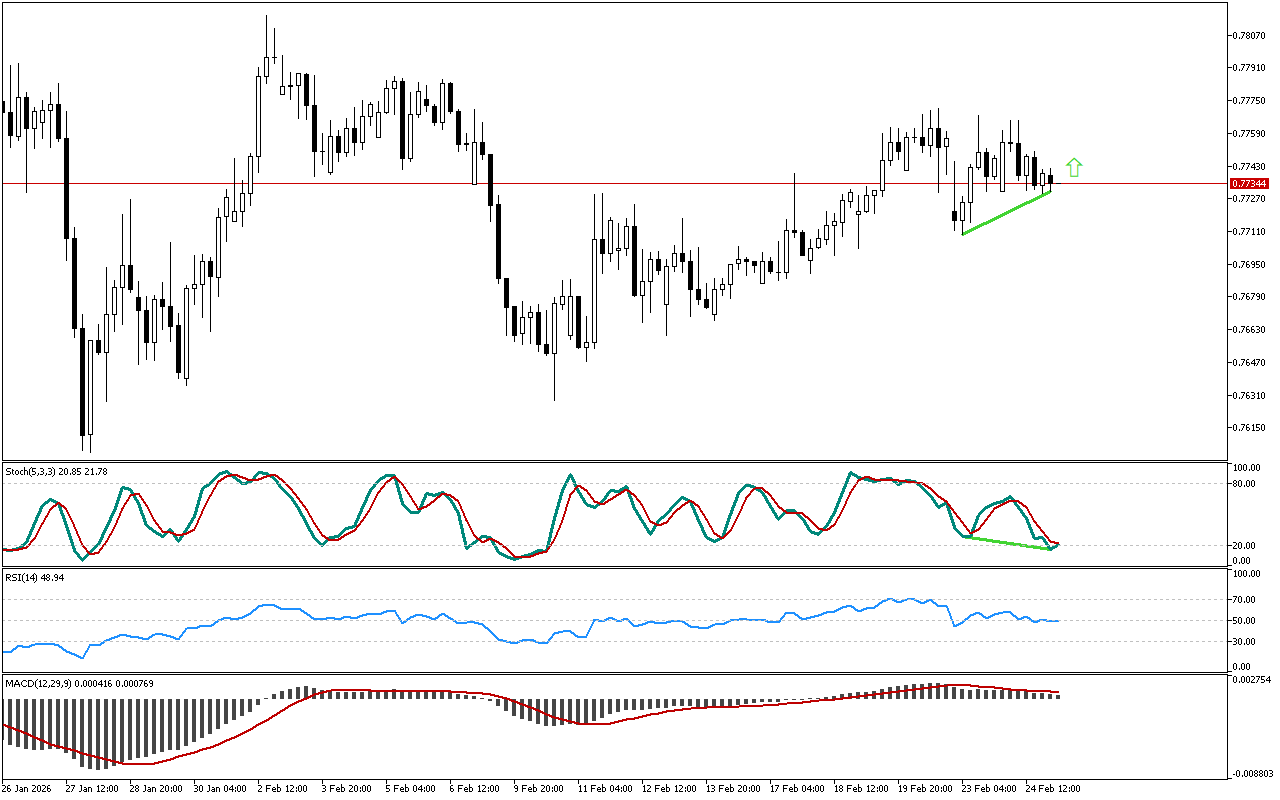
A classic divergence marked with a green line has been formed between the price chart and the RSI indicator. The Natural Gas price has updated its local low, while the indicator remains above the 30 mark.
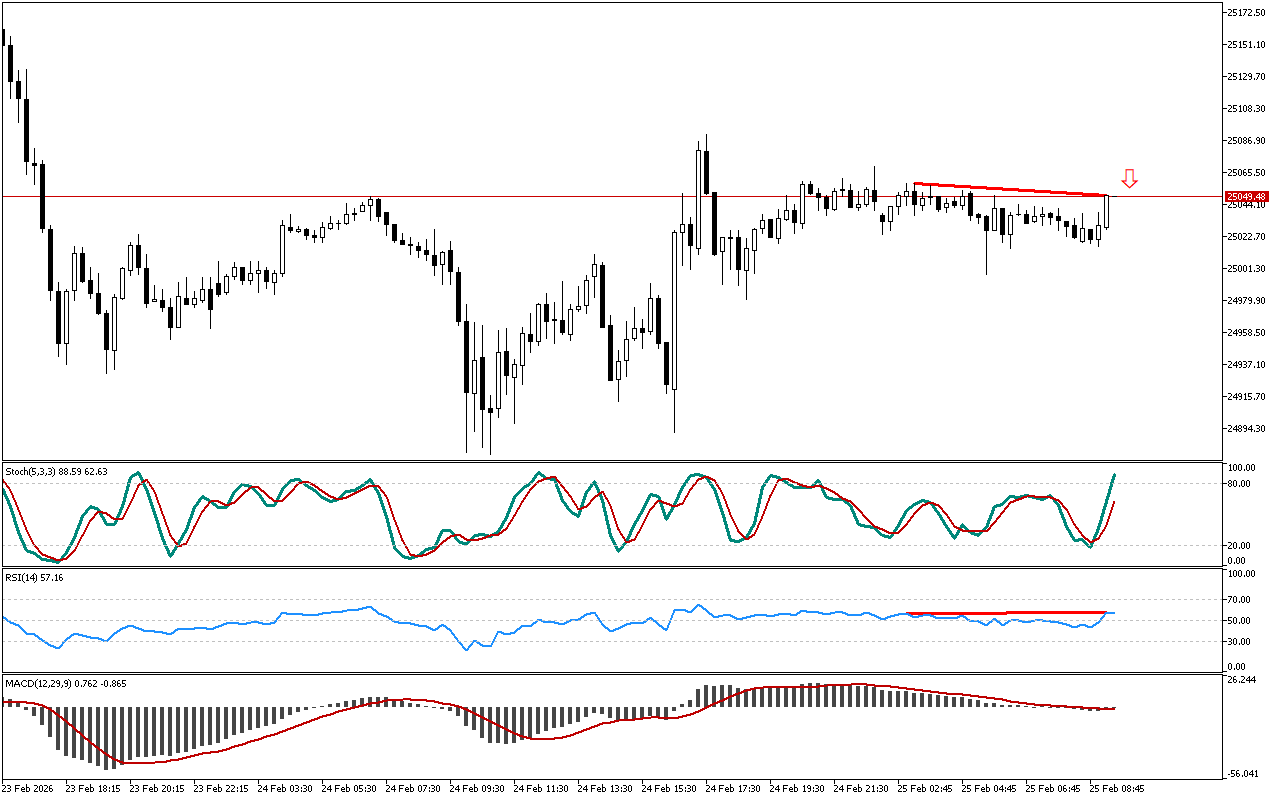
The MACD histogram is below the signal line. This indicator shows medium- and long-term trends and may ignore short-term price reversals and pullbacks sometimes.
On the Stochastic indicator, the blue main line remains below the signal red line. The current state of the indicator neither cancels nor contradicts signals received from other technical indicators.
The Natural Gas trade is better situated towards opening a long position strategy. Possible entry points include both current prices and retest levels of the designated resistance line.
📌 Entry: 3.124
✔️ First target: 3.155
✔️ Second target: 3.180
❌ Stop order: 3.104
Natural Gas M15: RSI signals a possible upward reversal
Leave a Reply