
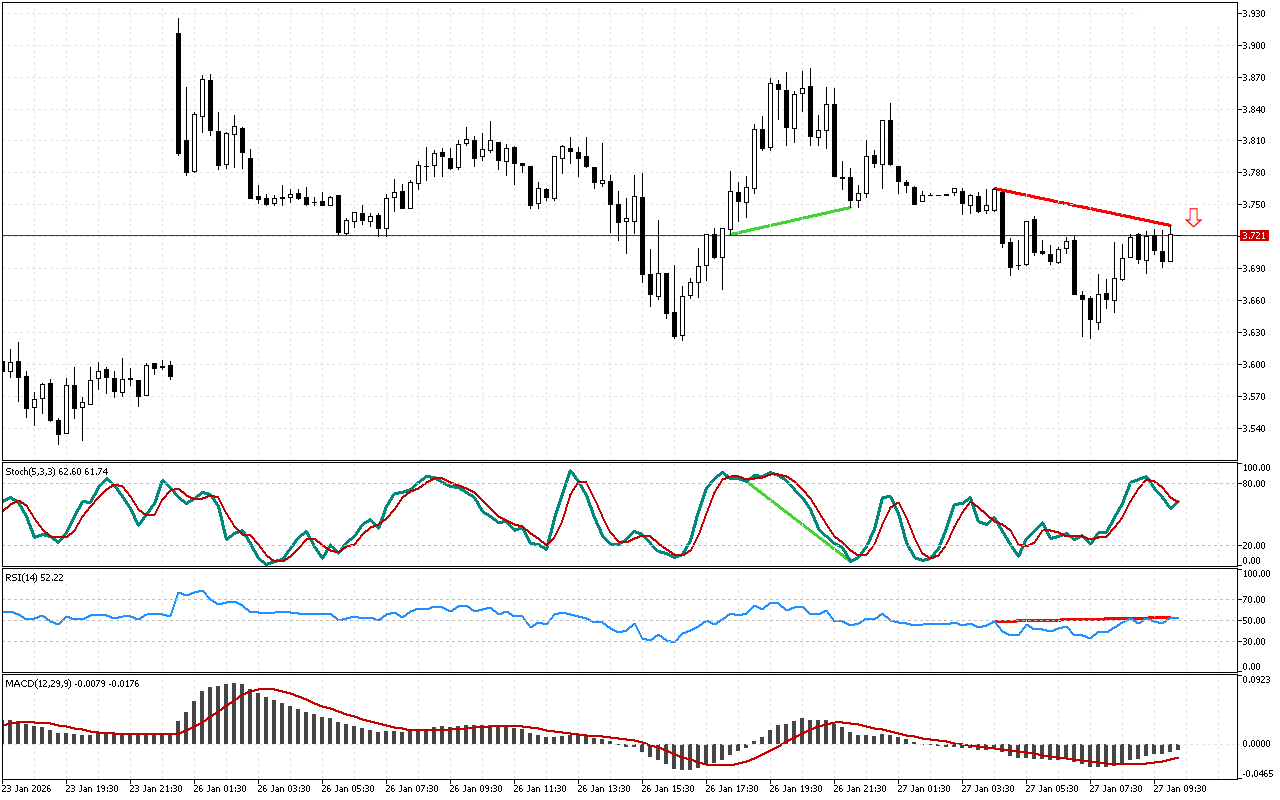
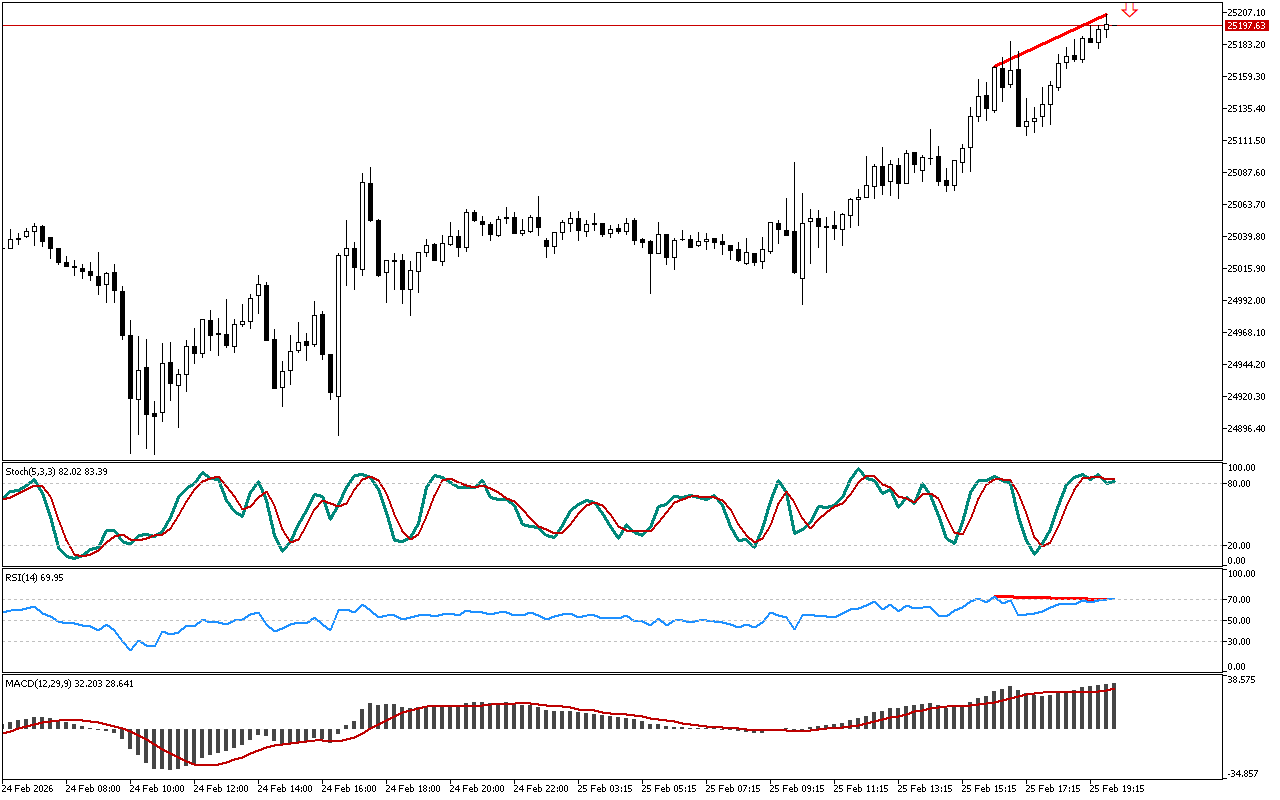
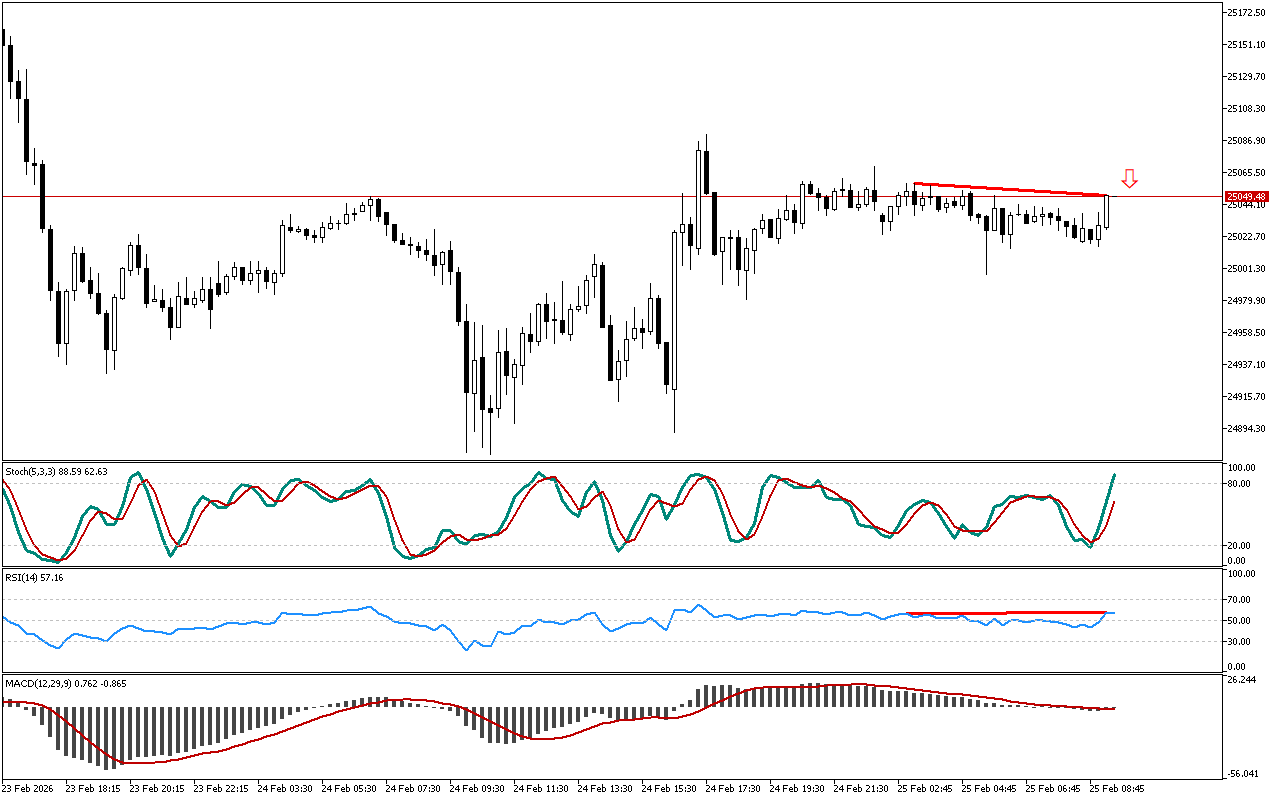
The RSI oscillator detects a discrepancy. The price failed to reach a new peak, while the RSI indicator rose above the previous intraday high, indicating a potential change in price movement dynamics.
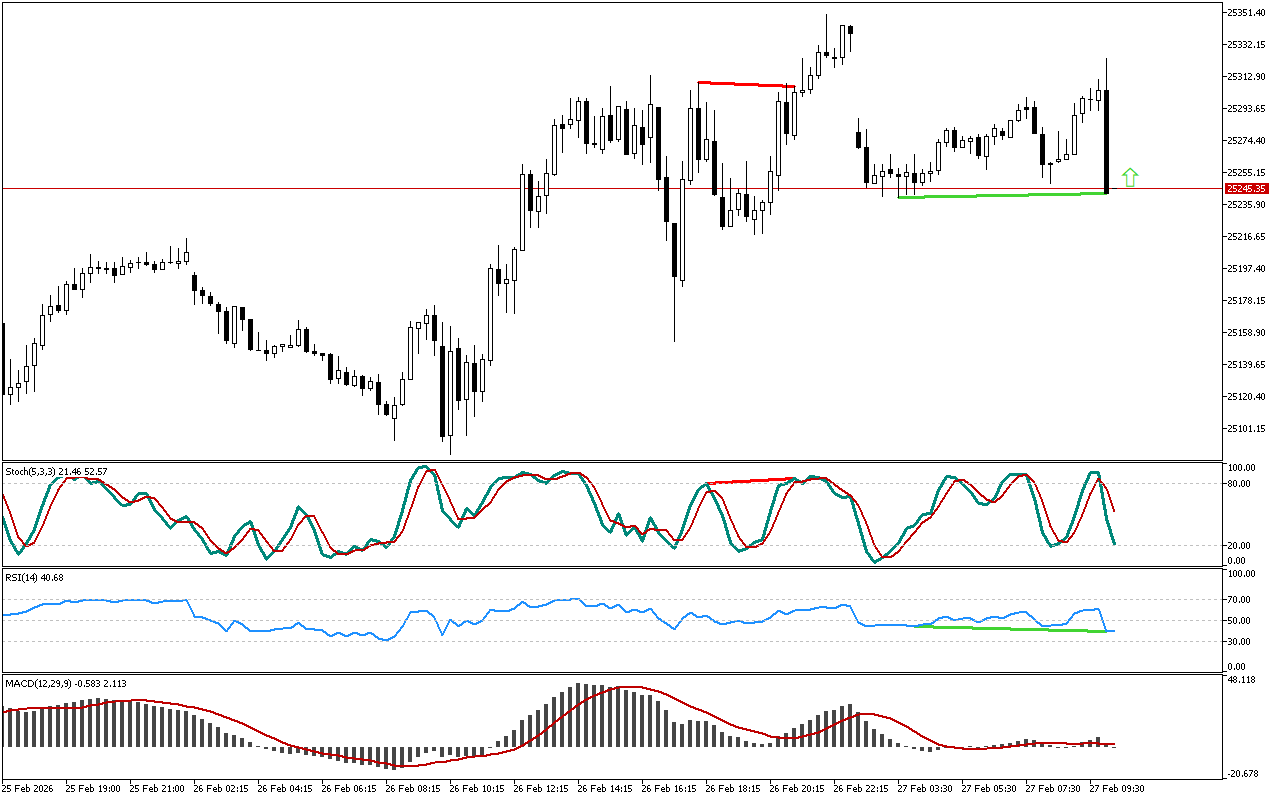
The histogram of the MACD indicator remains above the signal line, indicating the local development of an upward movement. However, the indicator indications do not contradict the signal, marked on the chart.
On the Stochastic indicator, the blue main line remains below the signal red line. The current state of the indicator neither cancels nor contradicts signals received from other technical indicators.
As far as Natural Gas is concerned, it is recommended to focus on short positions. Entry can be executed both at the current prices and upon a possible return to the resistance line.
📌 Entry: 3.721
✔️ First target: 3.625
✔️ Second target: 3.512
❌ Stop order: 3.792
Natural Gas M15: The downward divergence from RSI
Leave a Reply