
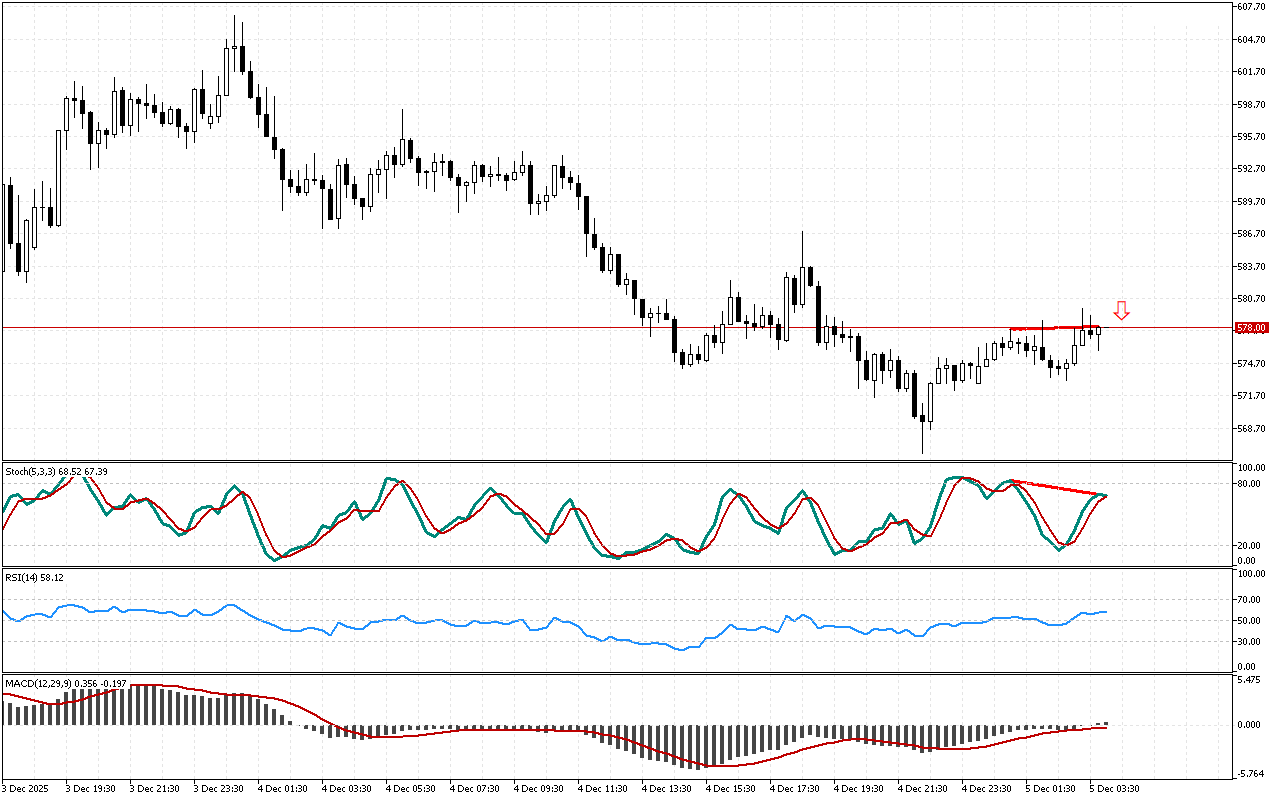
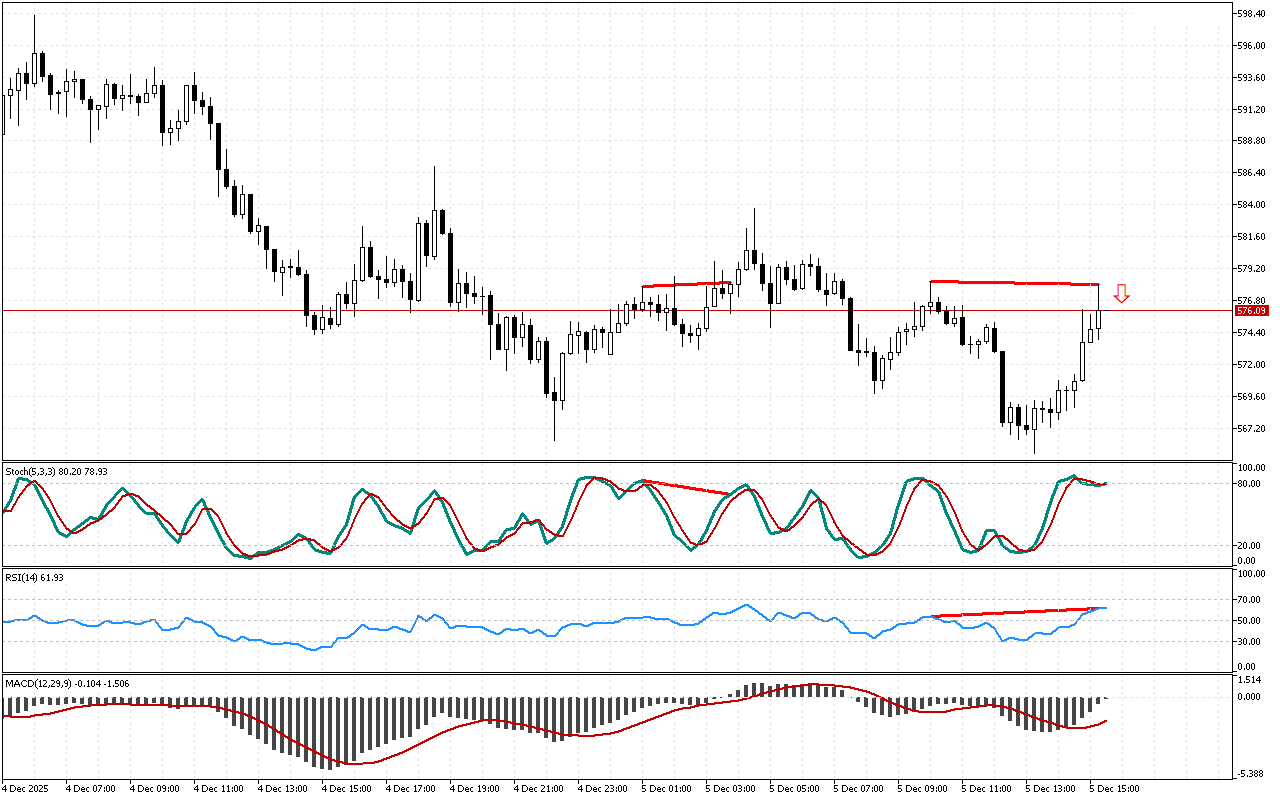
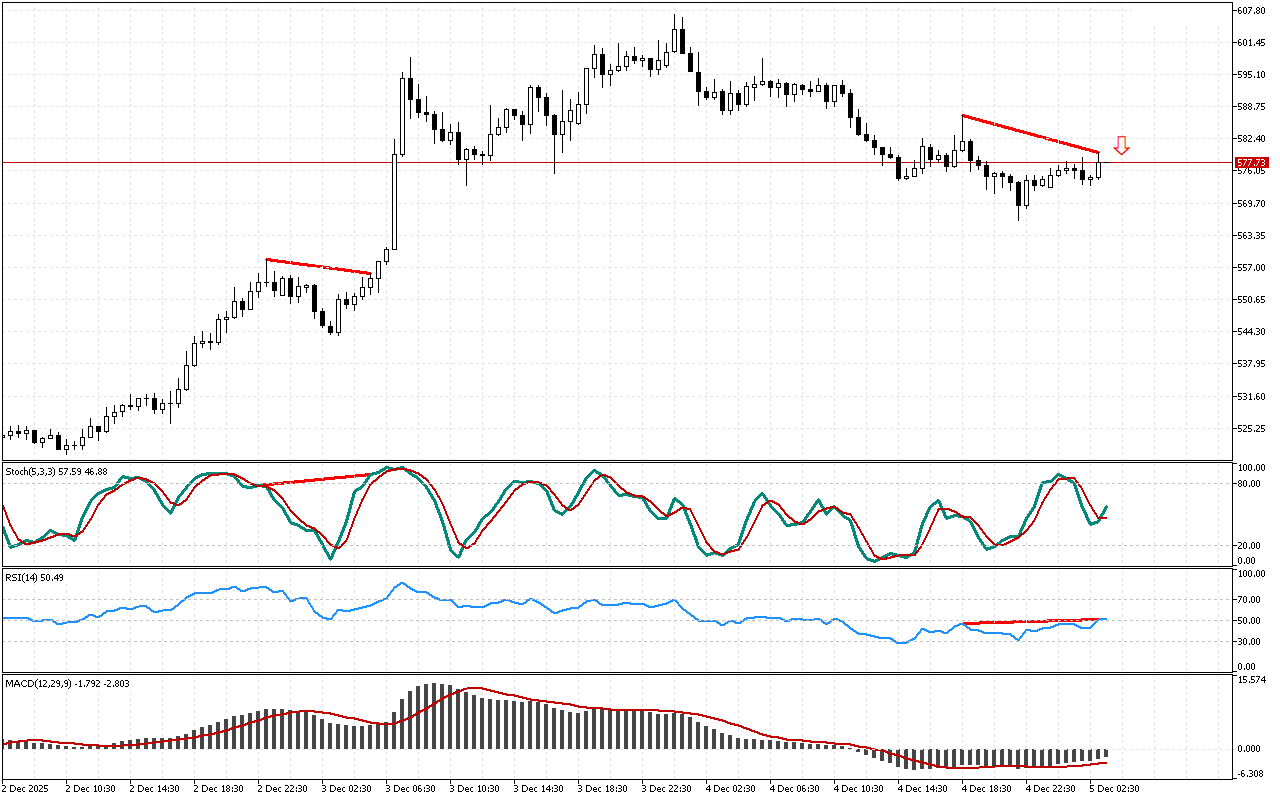
Let’s examine the Stochastic indicator. The oscillator shows the decay of the upward impulse along Bit.Cash. The price chart has updated the local maximum, but the Stochastic is declining. This divergence is marked with a red line.
The RSI is currently holding above the mark of 50. The indicator calculating formula logic suggests that, on average, the ascending movement is currently predominant.
The histogram of the MACD indicator remains above the signal line, indicating the local development of an upward movement. However, the indicator indications do not contradict the signal, marked on the chart.
At this time interval for Bit.Cash, trading recommendations suggest opening short positions.
📌 Entry: 578.01
✔️ First target: 573.12
✔️ Second target: 568.08
❌ Stop order: 581.34
Bit.Cash M15: A reversal signal from the Stochastic indicator
Leave a Reply