
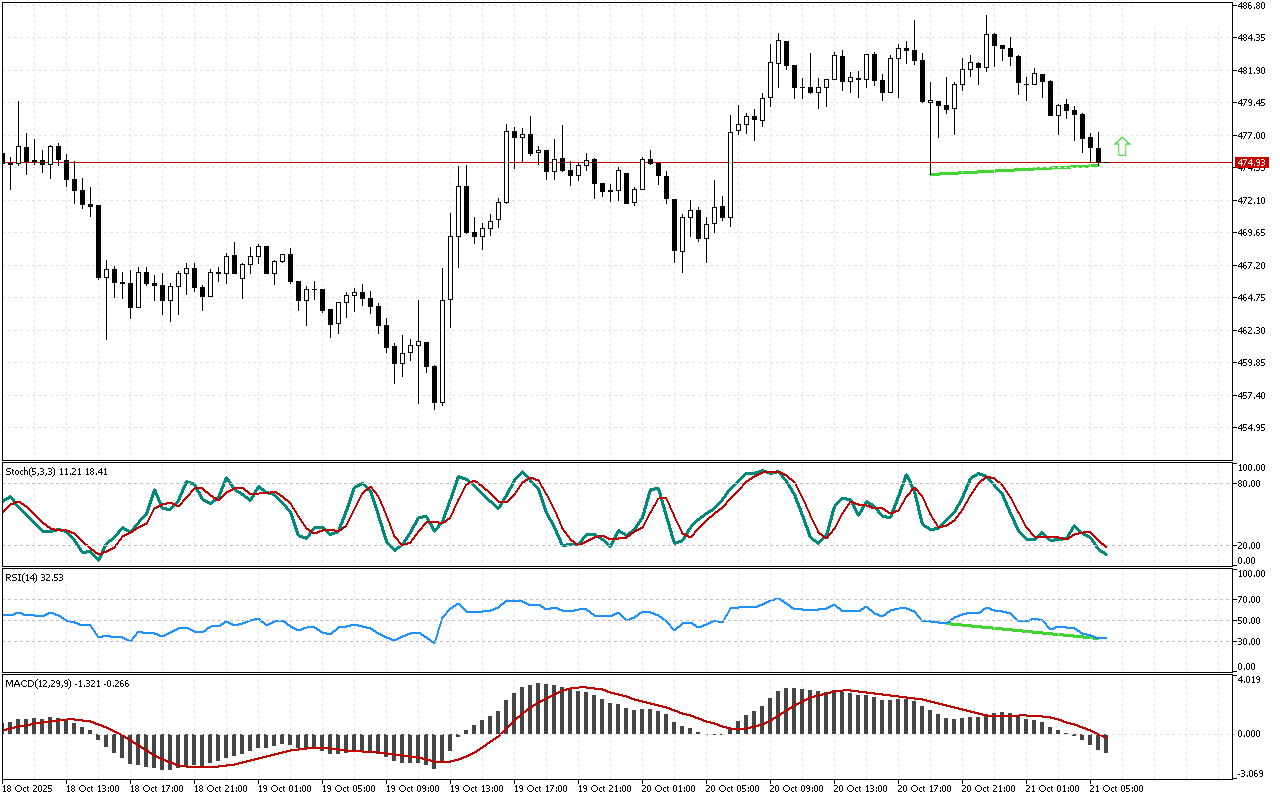
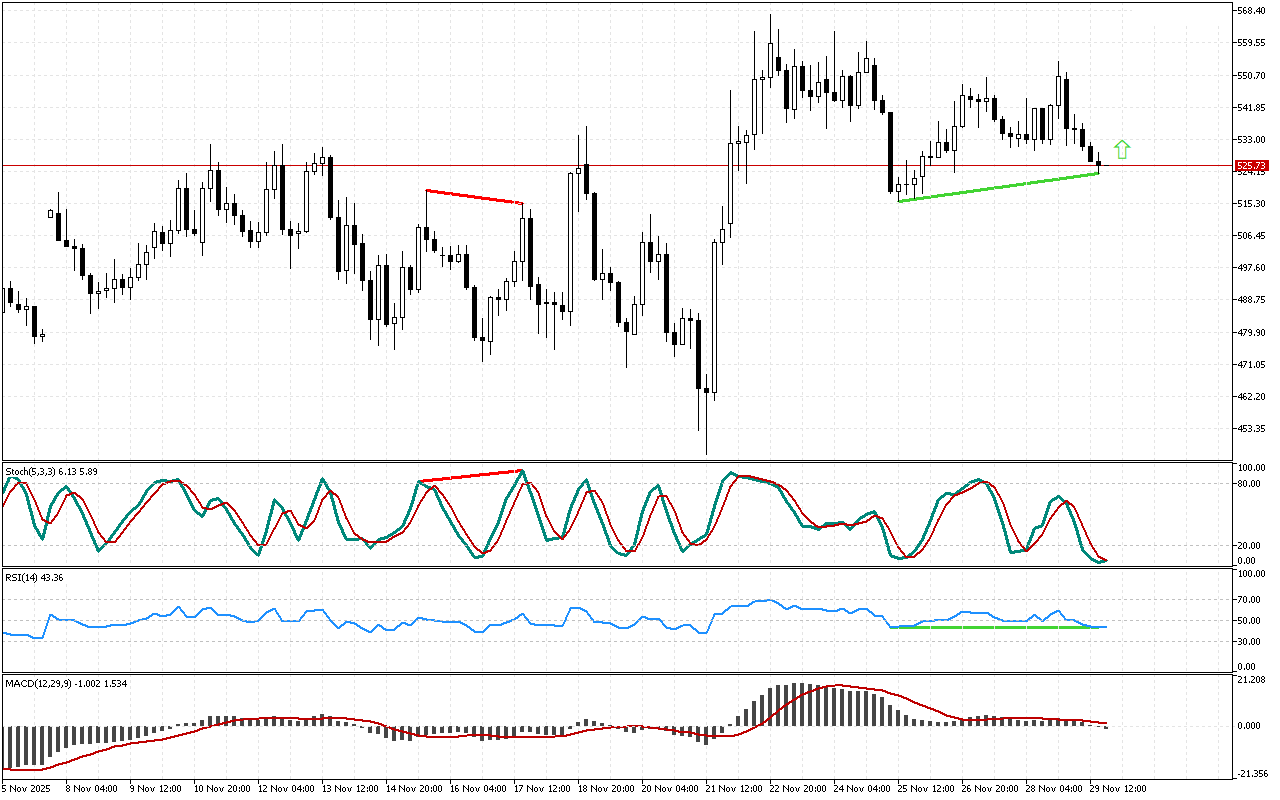
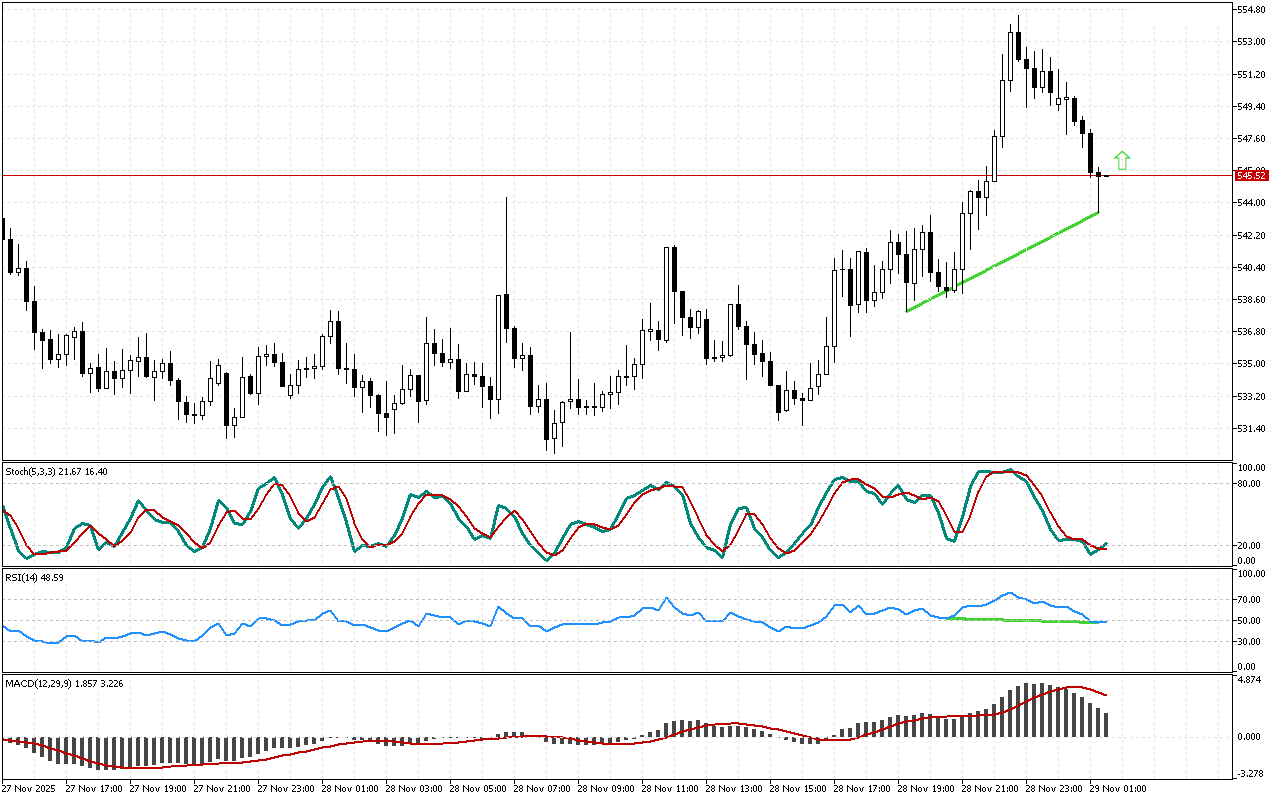
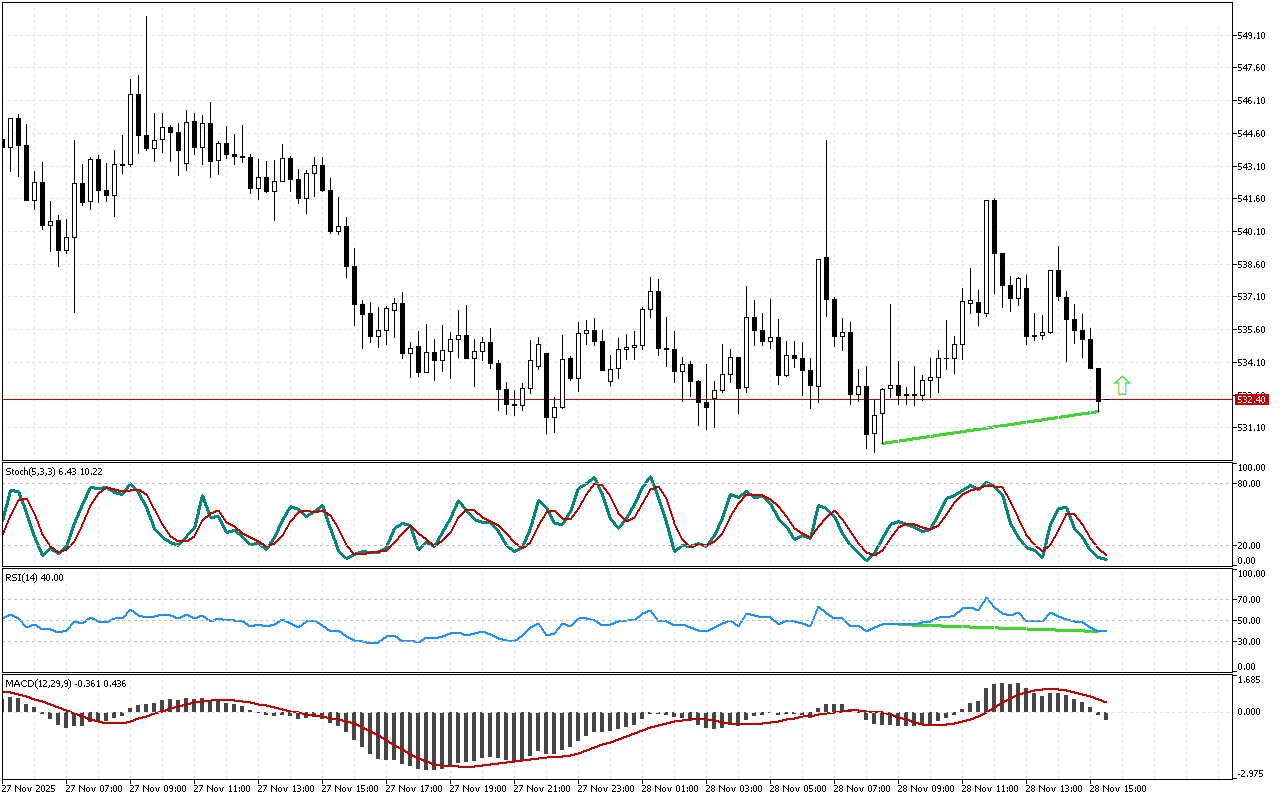
The price failed to reach a new low, while the RSI indicator shows an upward trend. The formed reverse divergence could signal a potential price reversal upward.
The MACD histogram is below the signal line. This indicator shows medium- and long-term trends and may ignore short-term price reversals and pullbacks sometimes.
On the Stochastic indicator, the blue main line remains below the signal red line. The current state of the indicator neither cancels nor contradicts signals received from other technical indicators.
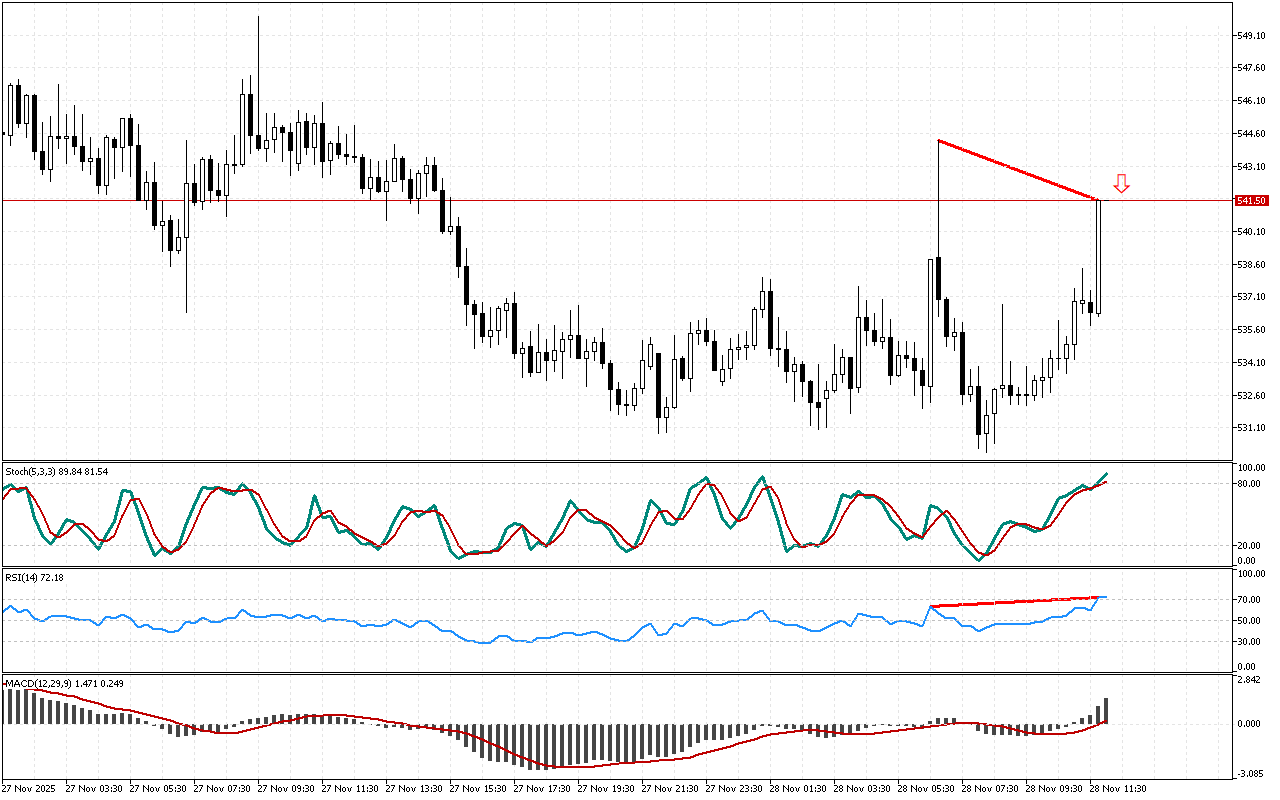
The strategy for Bit.Cash should embrace long positions based on this graphical representation. A trader can enter the market either at the current prices or when return to the marked resistance level is implemented.
📌 Entry: 474.95
✔️ First target: 486.01
✔️ Second target: 492.88
❌ Stop order: 468.94
Bit.Cash M30: RSI signals a possible upward reversal
Leave a Reply