
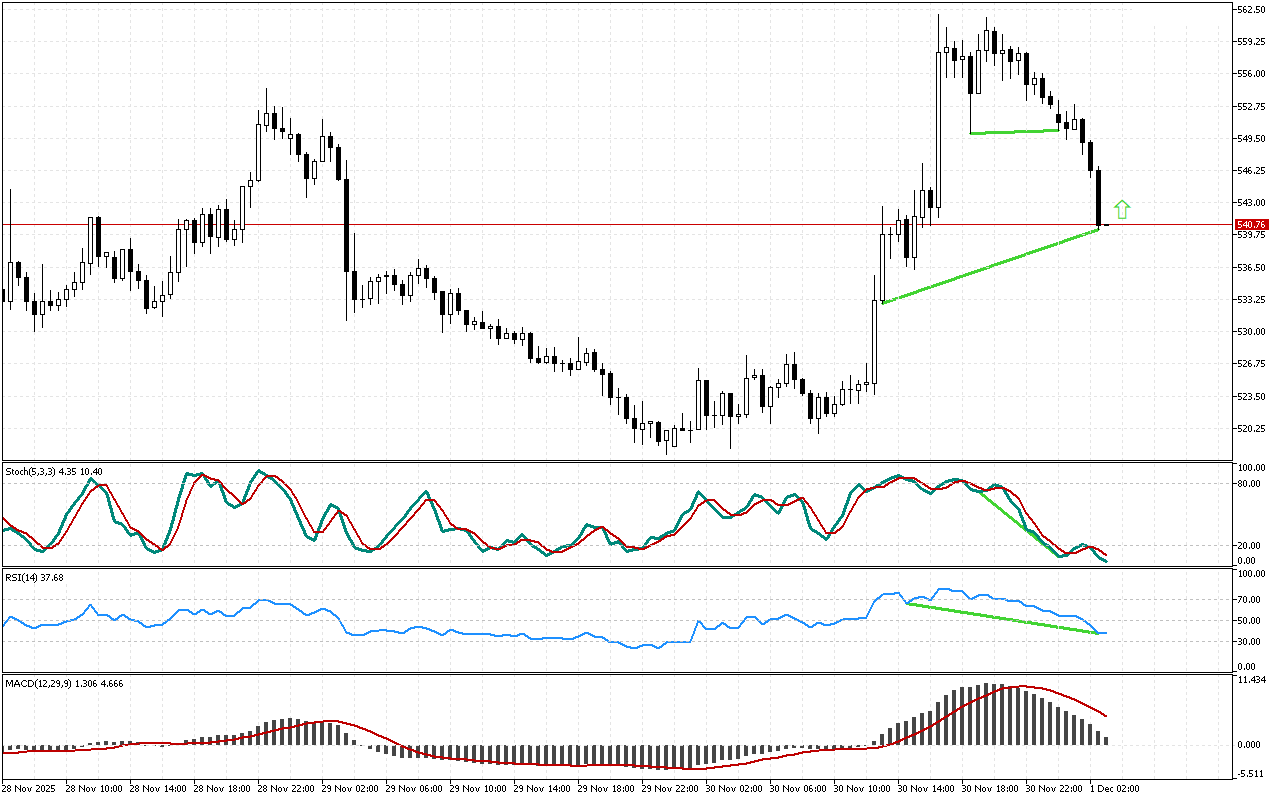
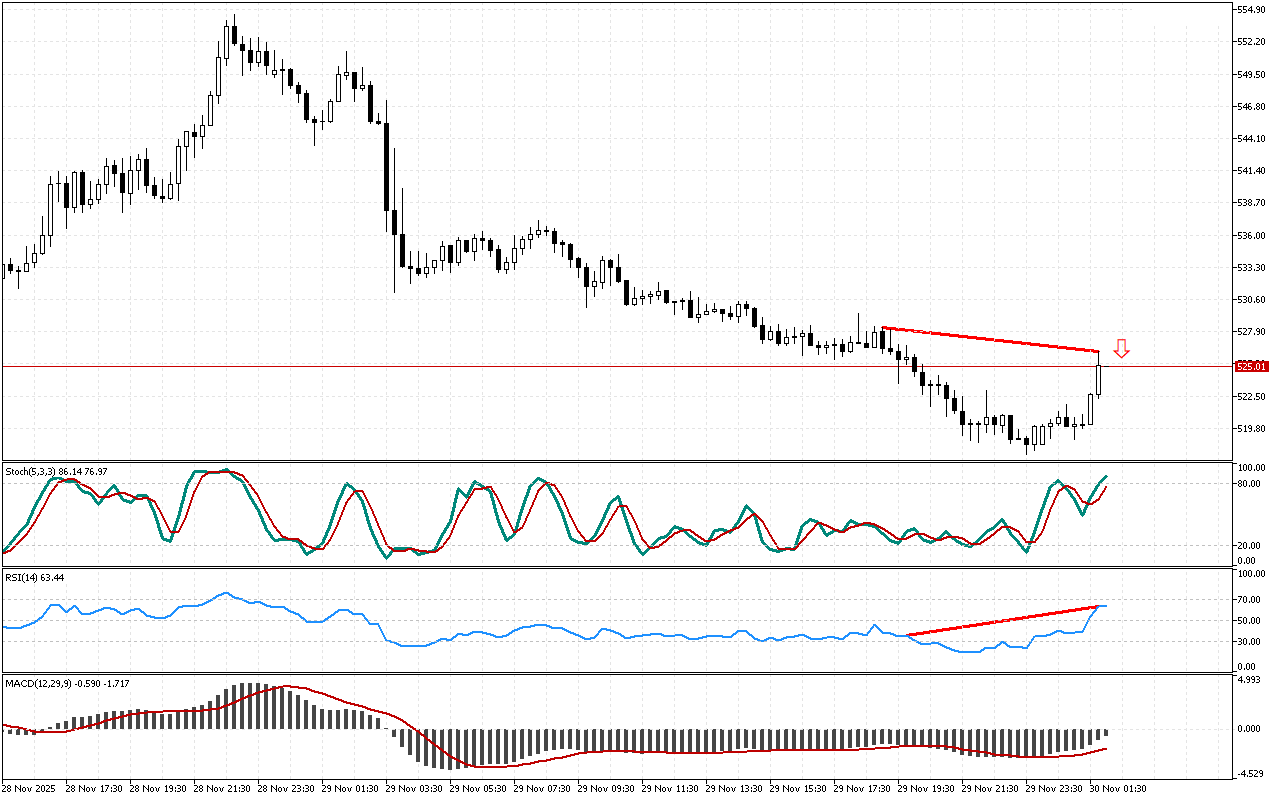
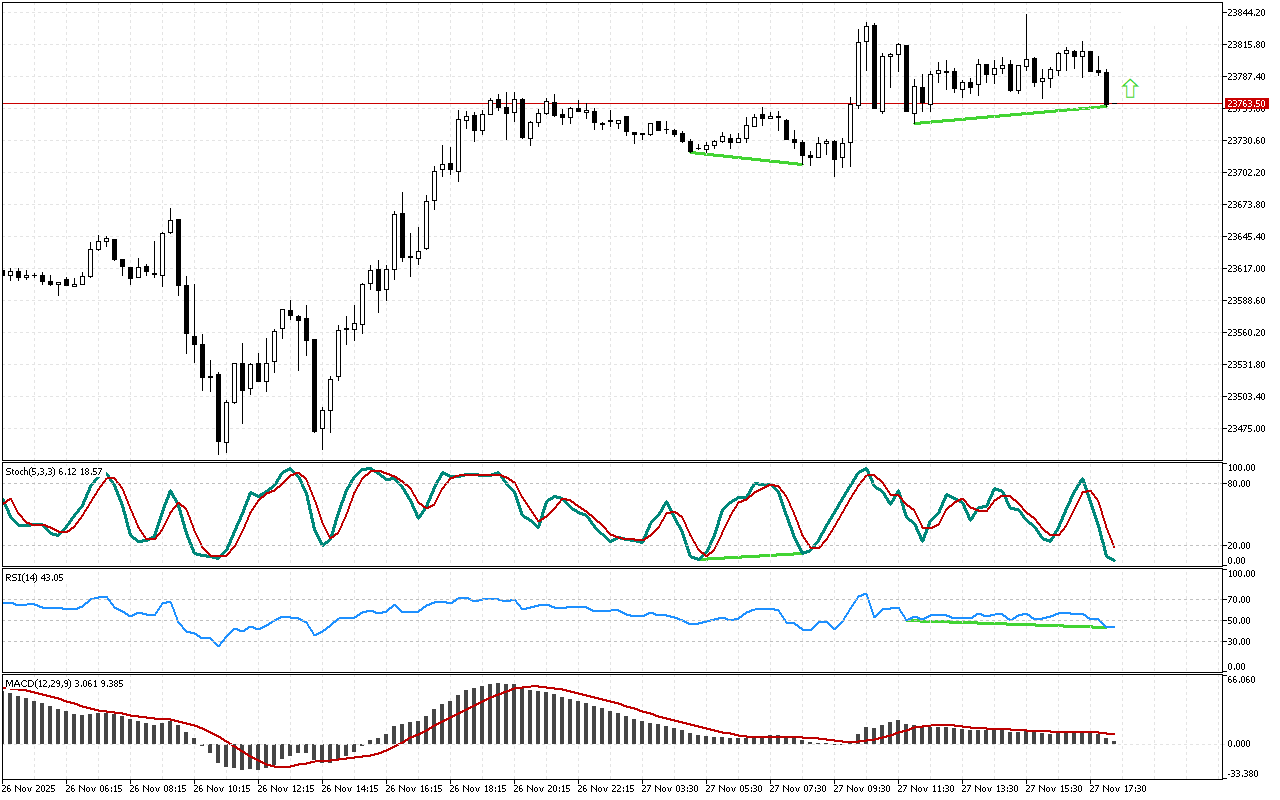
A classic divergence marked with a green line has been formed between the price chart and the RSI indicator. The Bit.Cash price has updated its local low, while the indicator remains above the 30 mark.
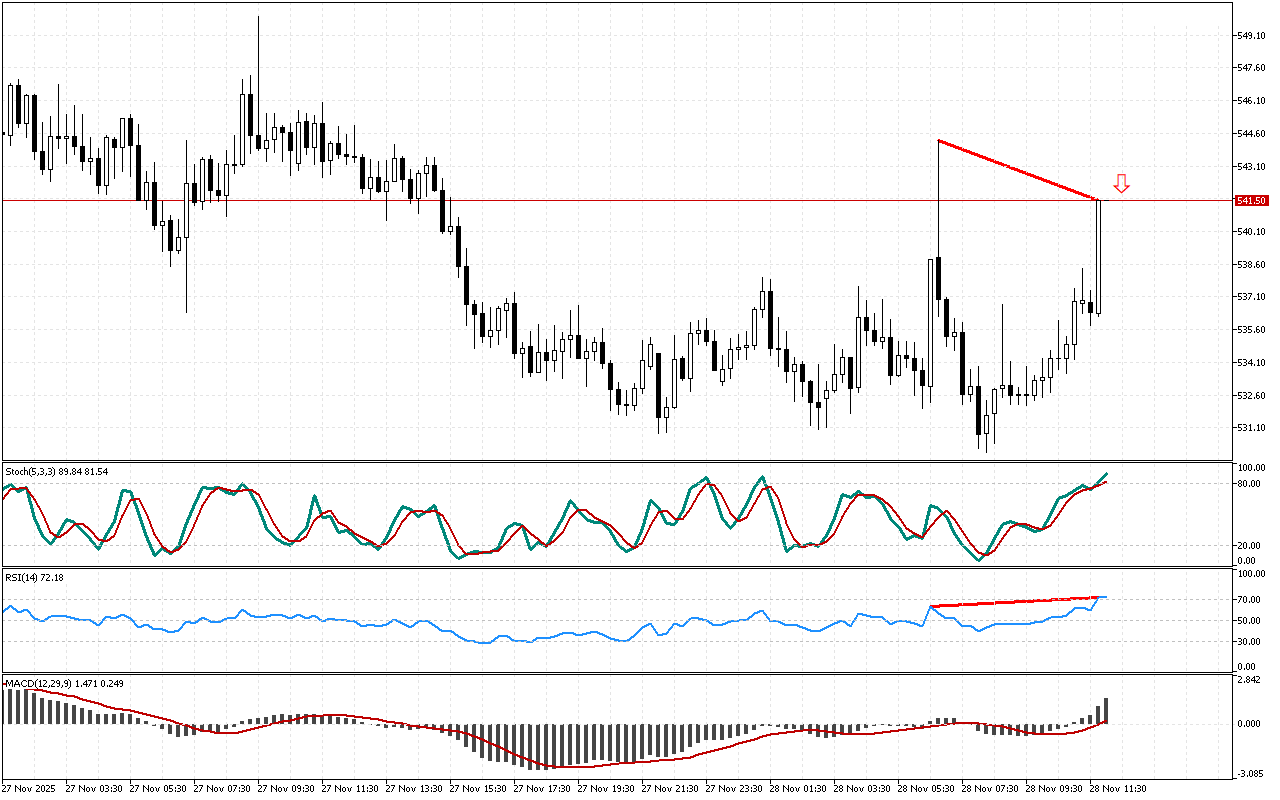
The MACD histogram is below the signal line. This indicator shows medium- and long-term trends and may ignore short-term price reversals and pullbacks sometimes.
On the Stochastic indicator, the blue main line remains below the signal red line. The current state of the indicator neither cancels nor contradicts signals received from other technical indicators.
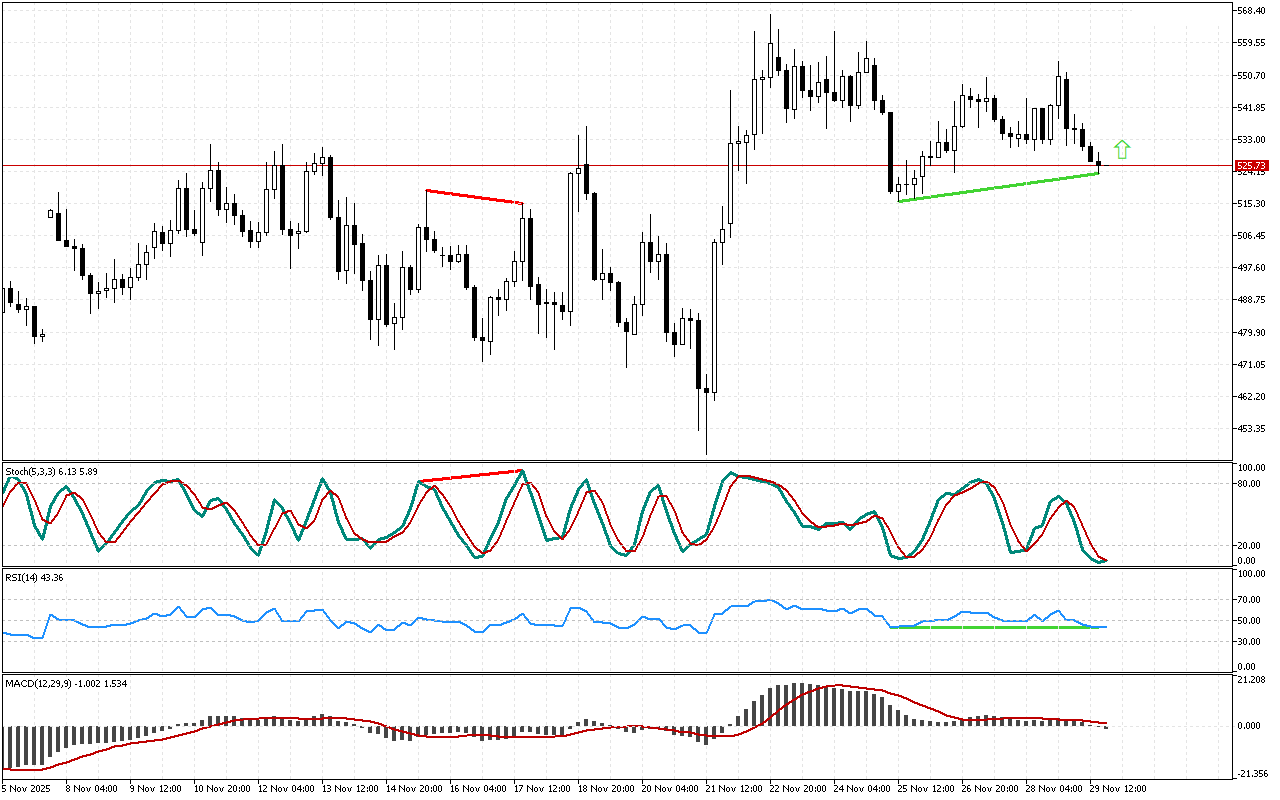
Currently, trading Bit.Cash assumes the priority of long positions. A trader can enter the market both at the current levels or when retesting of the resistance level occurs.
📌 Entry: 486.32
✔️ First target: 511.22
✔️ Second target: 536.80
❌ Stop order: 469.36
Bit.Cash M30: RSI signals a possible upward reversal

Leave a Reply