
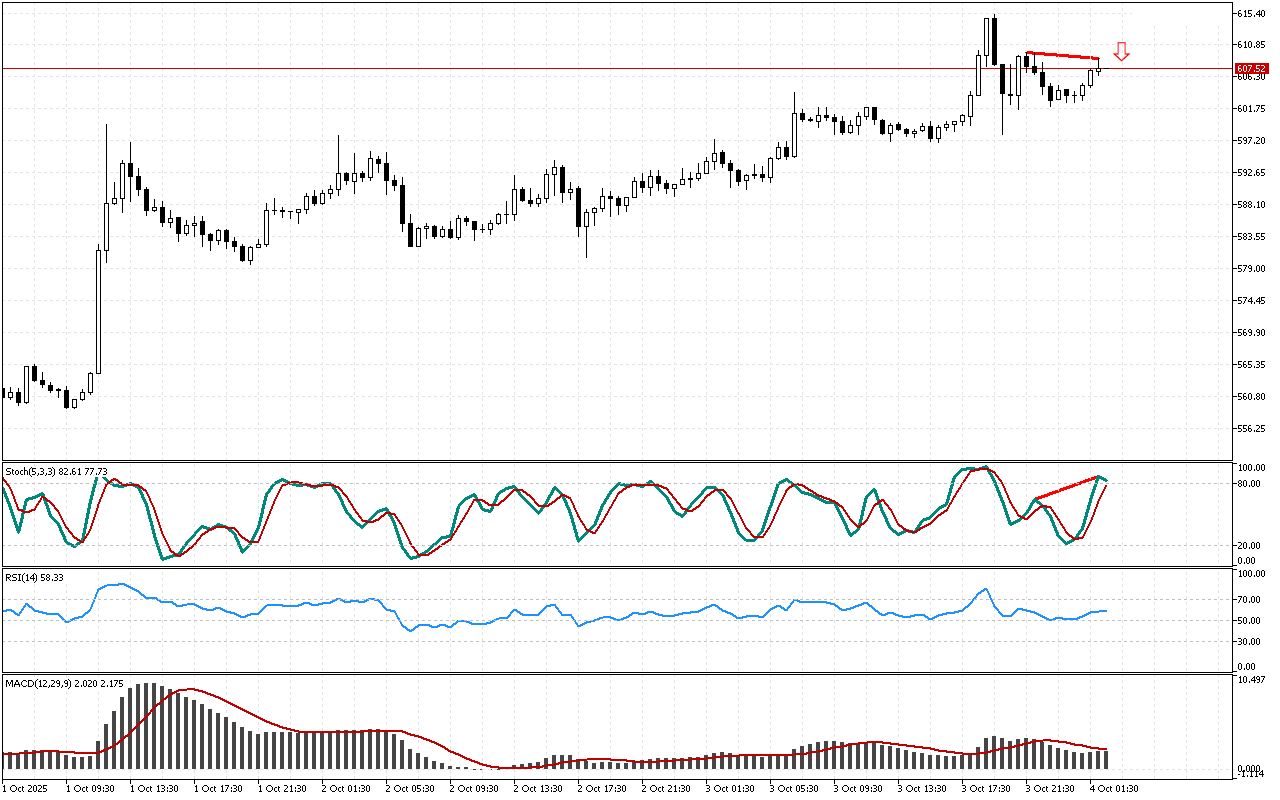
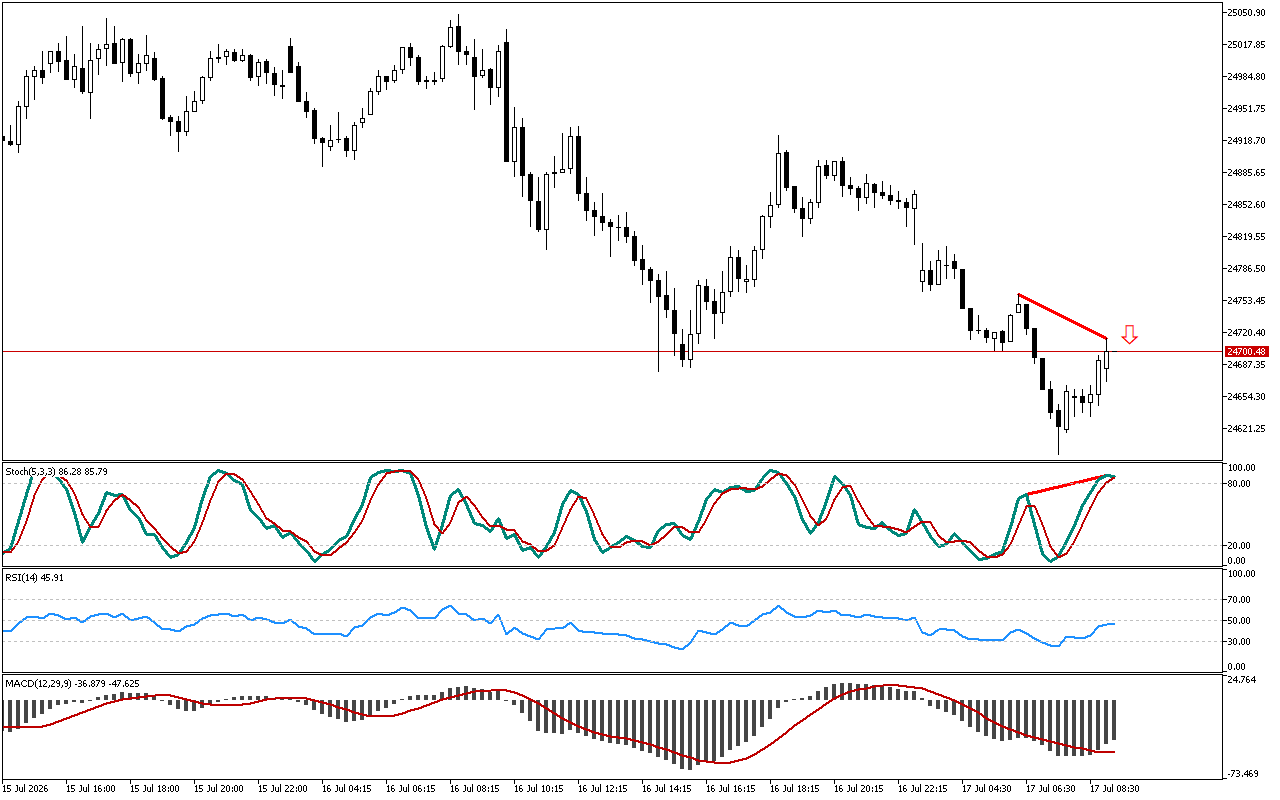
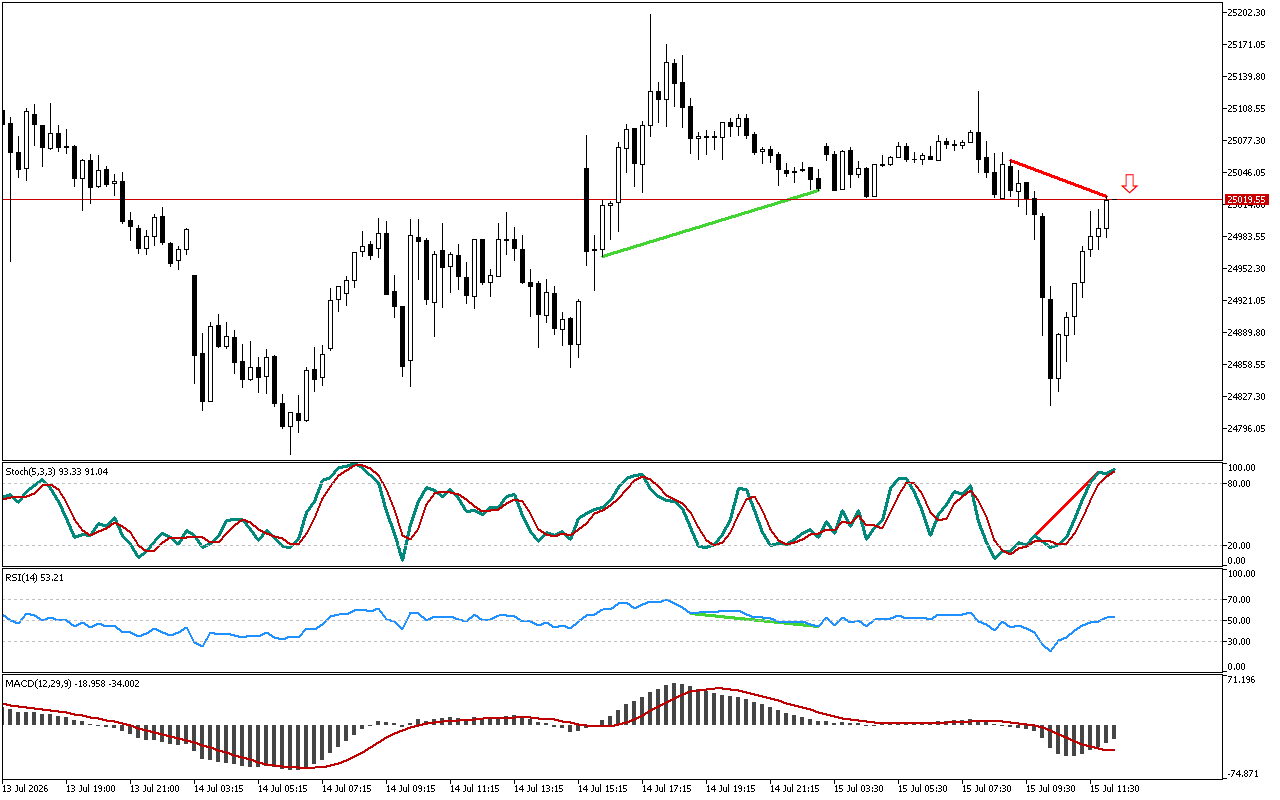
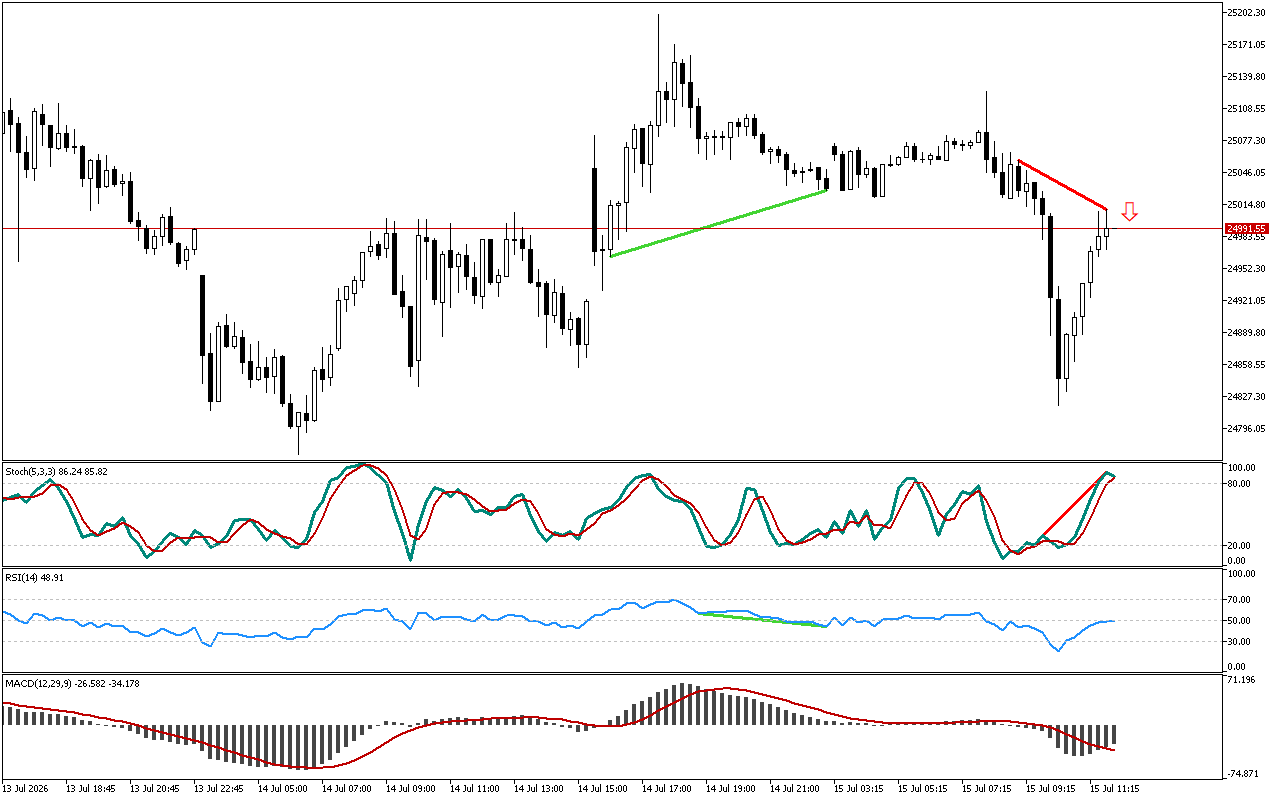
The price failed to form a new high, while the Stochastic indicator remains above the 20 level. This divergence, marked with a red line on the chart, indicates weakening of an upward momentum and increases the probability of a price decline.
The RSI is currently holding above the mark of 50. The indicator calculating formula logic suggests that, on average, the ascending movement is currently predominant.
The MACD histogram is below the signal line. This indicator shows medium- and long-term trends and may ignore short-term price reversals and pullbacks sometimes.
Short positions in respect to Bit.Cash look more warranted strategically. More conservative traders may consider entering upon a retest of this level. With a more aggressive strategy, a trader can enter at or around the current prices.
📌 Entry: 607.54
✔️ First target: 602.06
✔️ Second target: 595.92
❌ Stop order: 611.36
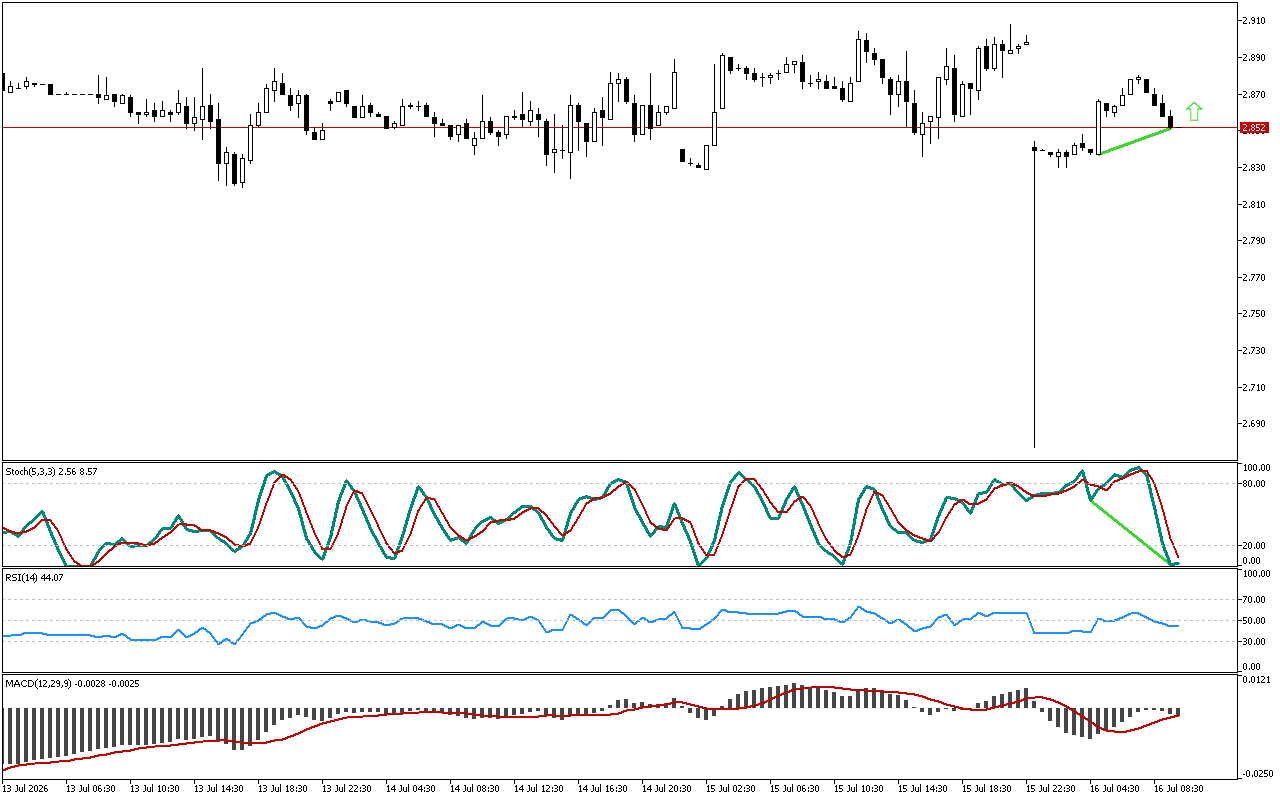
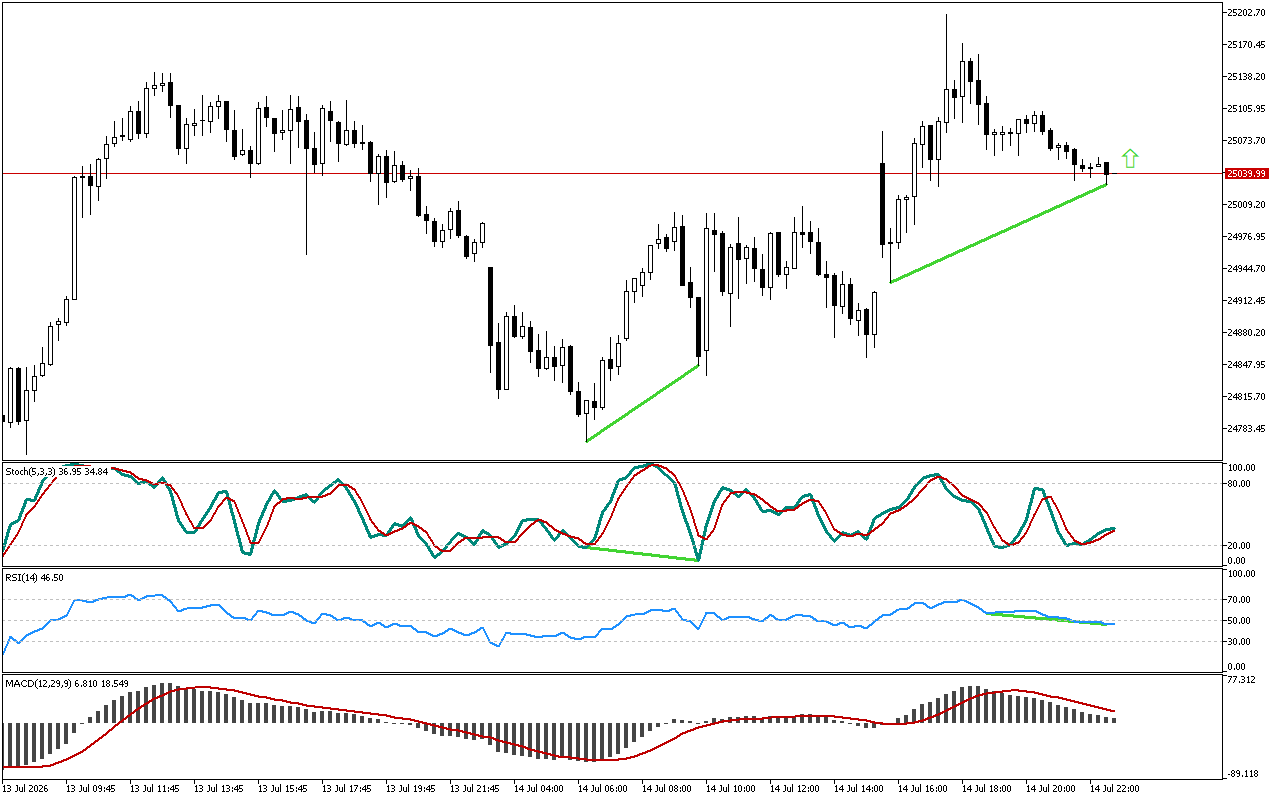
Bit.Cash M30: A reversal signal from the Stochastic indicator
Leave a Reply