
A classic divergence marked with a green line has been formed between the price chart and the RSI indicator. The…
Read More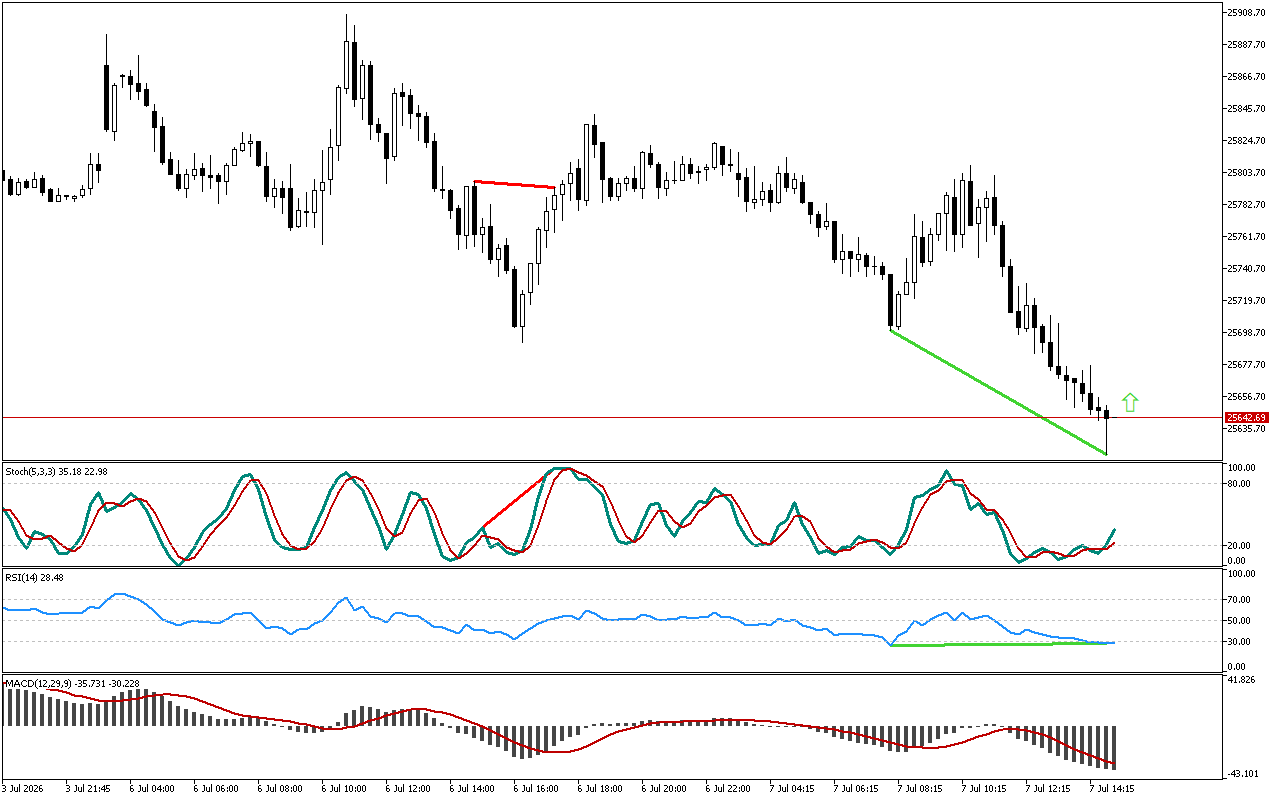

A classic divergence marked with a green line has been formed between the price chart and the RSI indicator. The…
Read More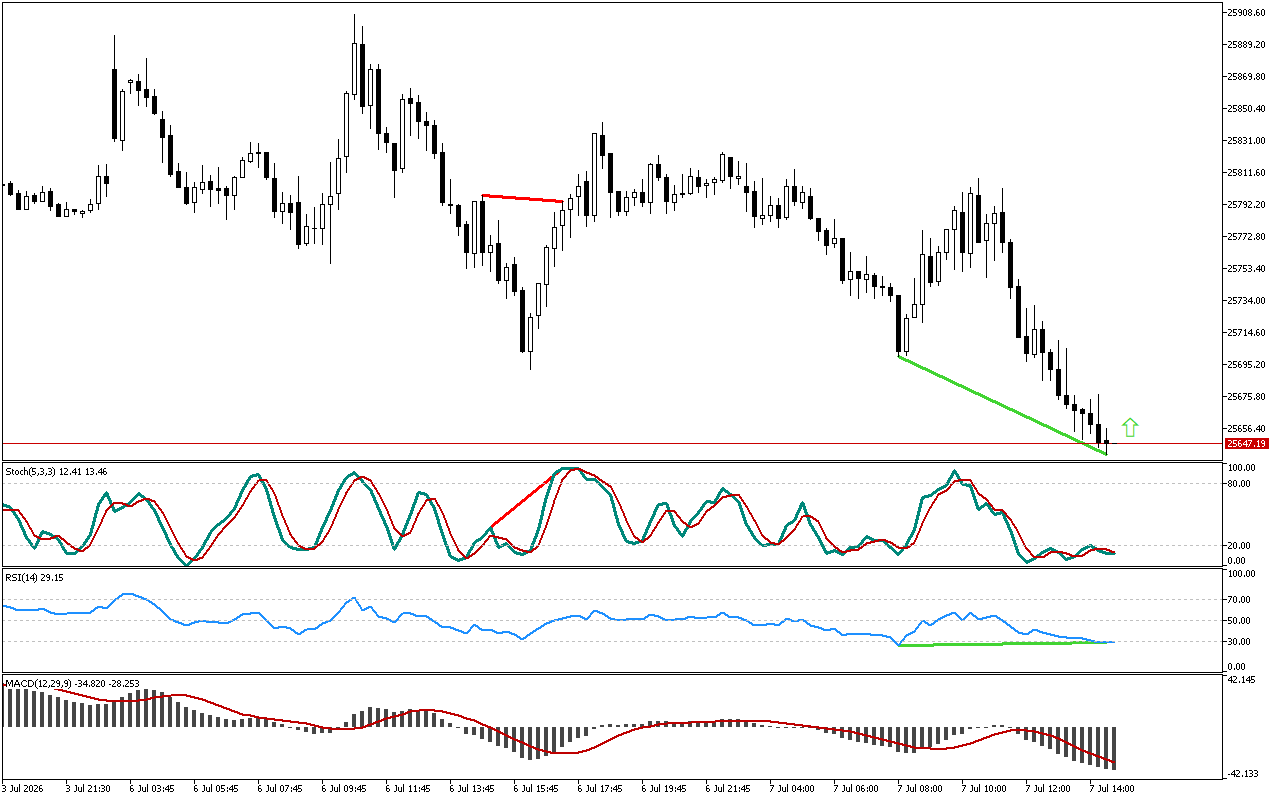
A classic divergence marked with a green line has been formed between the price chart and the RSI indicator. The…
Read More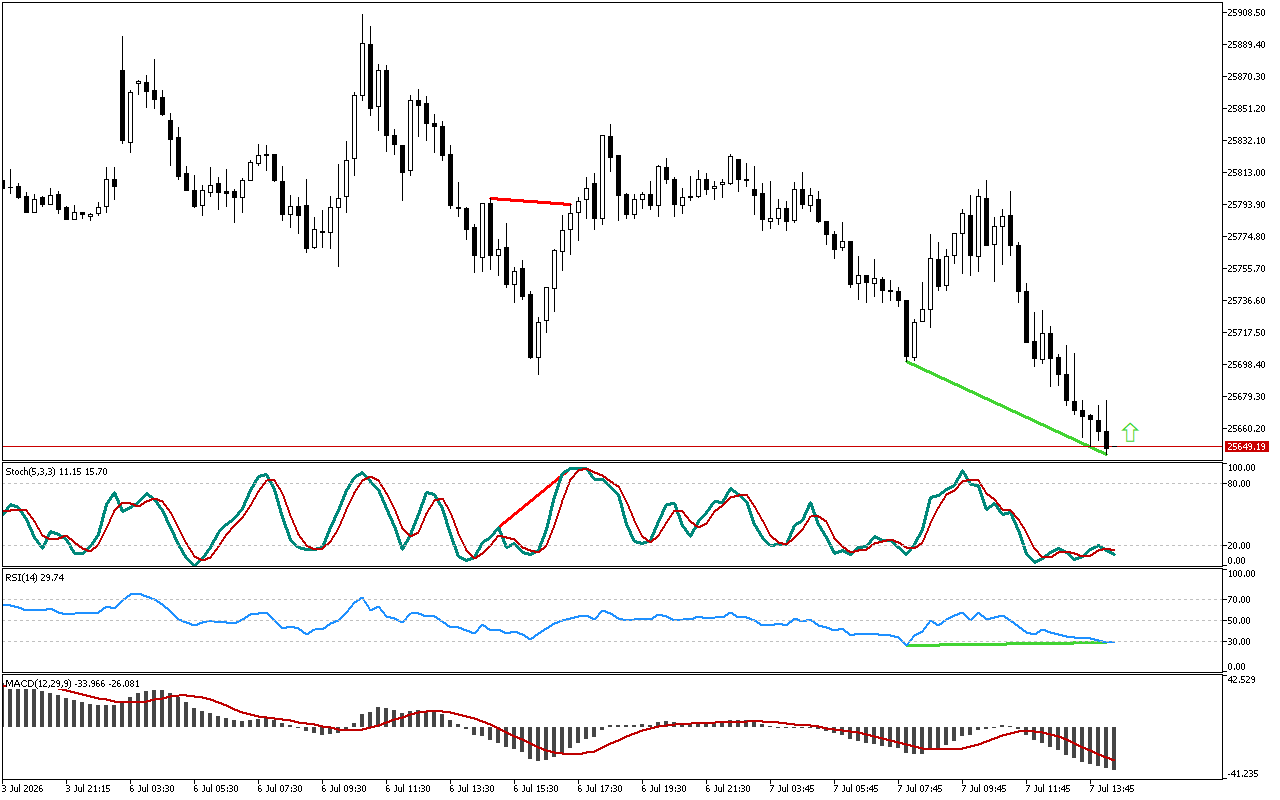
A classic divergence marked with a green line has been formed between the price chart and the RSI indicator. The…
Read More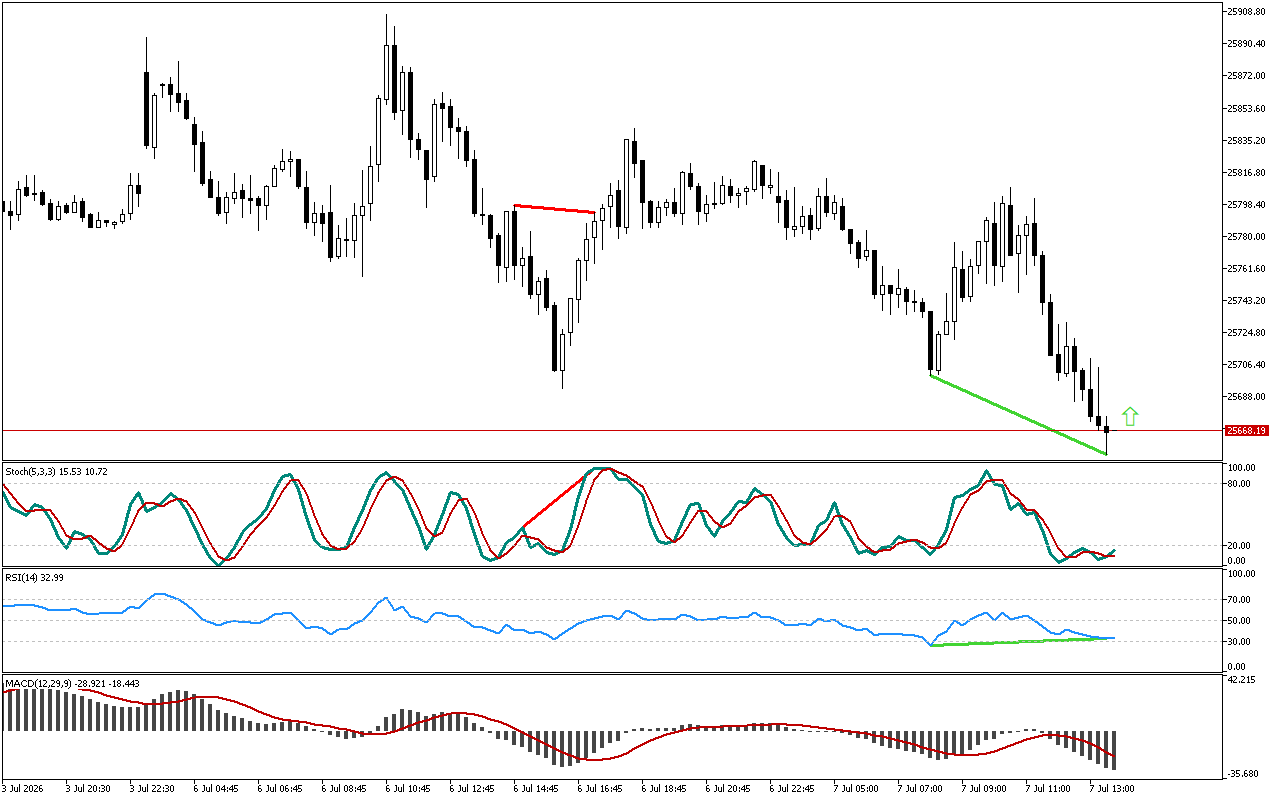
A classic divergence marked with a green line has been formed between the price chart and the RSI indicator. The…
Read More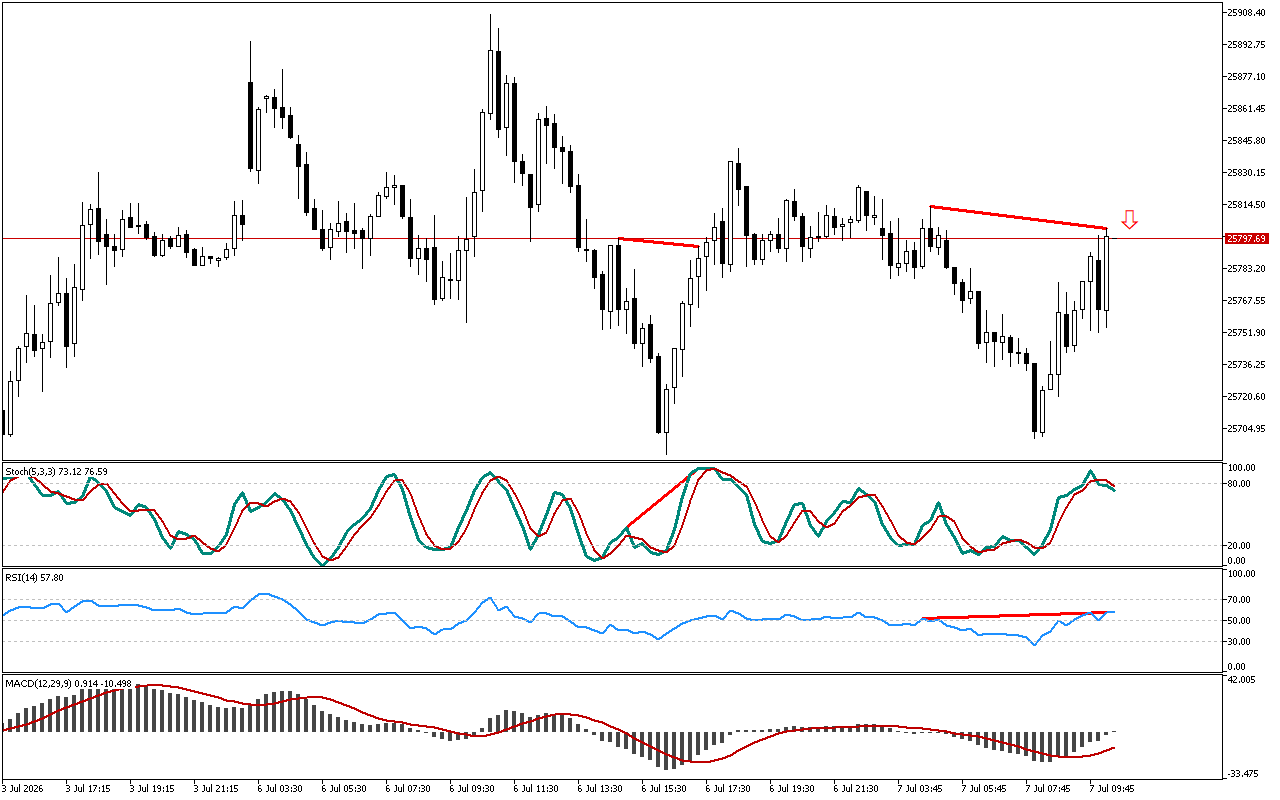
The RSI oscillator detects a discrepancy. The price failed to reach a new peak, while the RSI indicator rose above…
Read More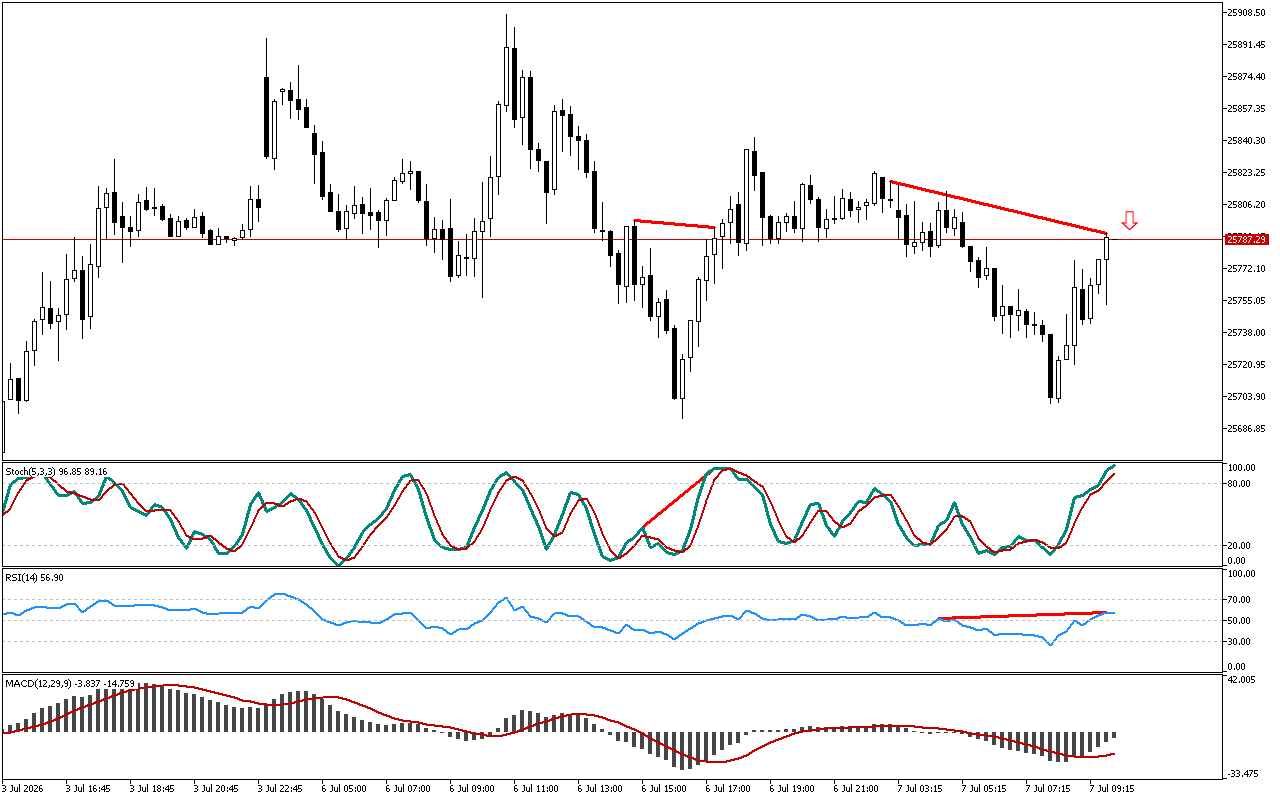
The RSI oscillator detects a discrepancy. The price failed to reach a new peak, while the RSI indicator rose above…
Read More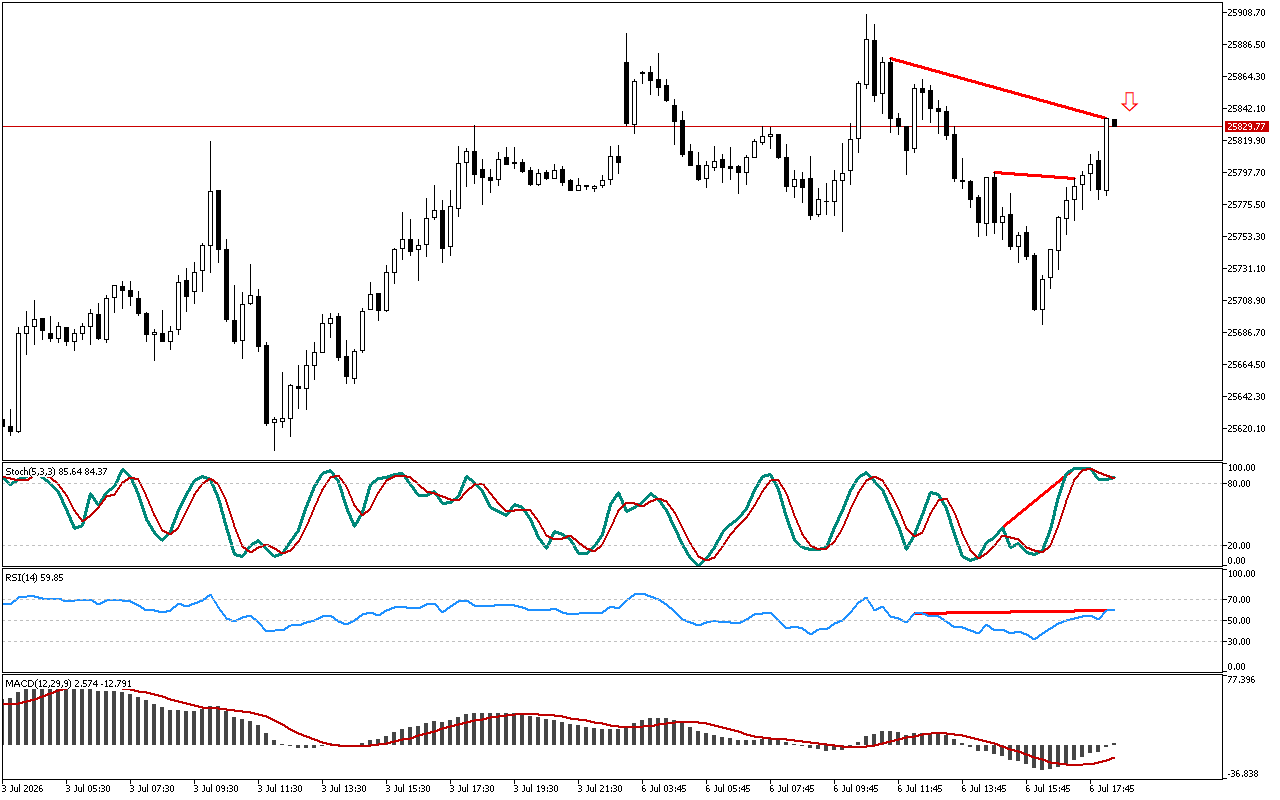
The RSI oscillator detects a discrepancy. The price failed to reach a new peak, while the RSI indicator rose above…
Read More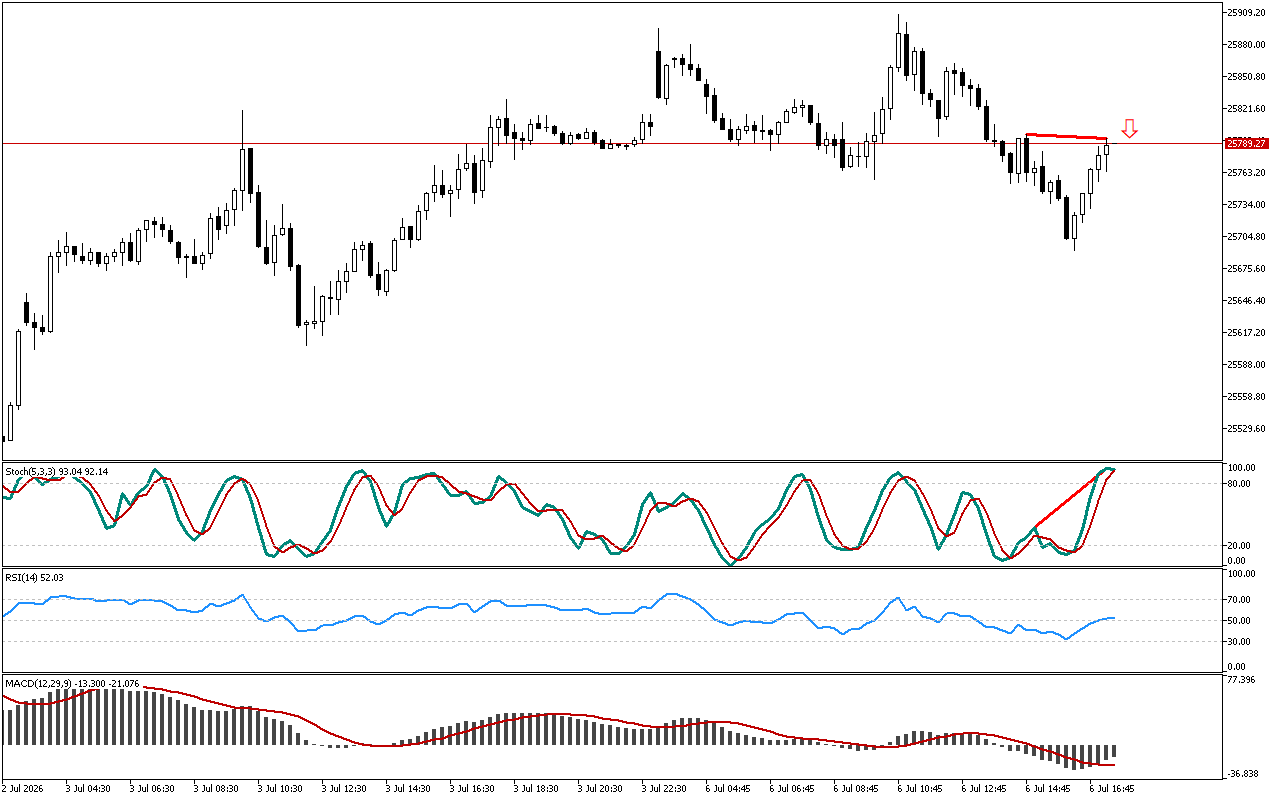
Let’s examine the Stochastic indicator. The oscillator shows the decay of the upward impulse along DAX 40. The price chart…
Read More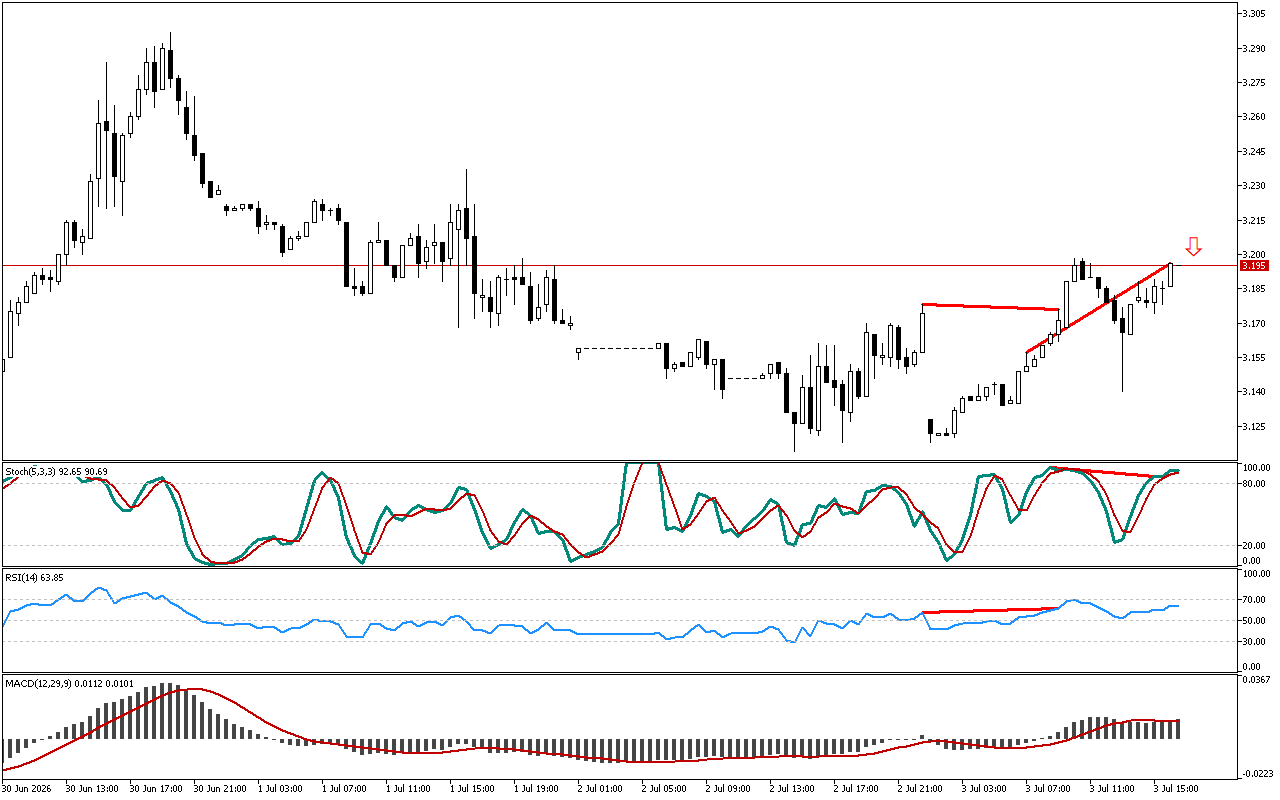
Let’s examine the Stochastic indicator. The oscillator shows the decay of the upward impulse along Natural Gas. The price chart…
Read More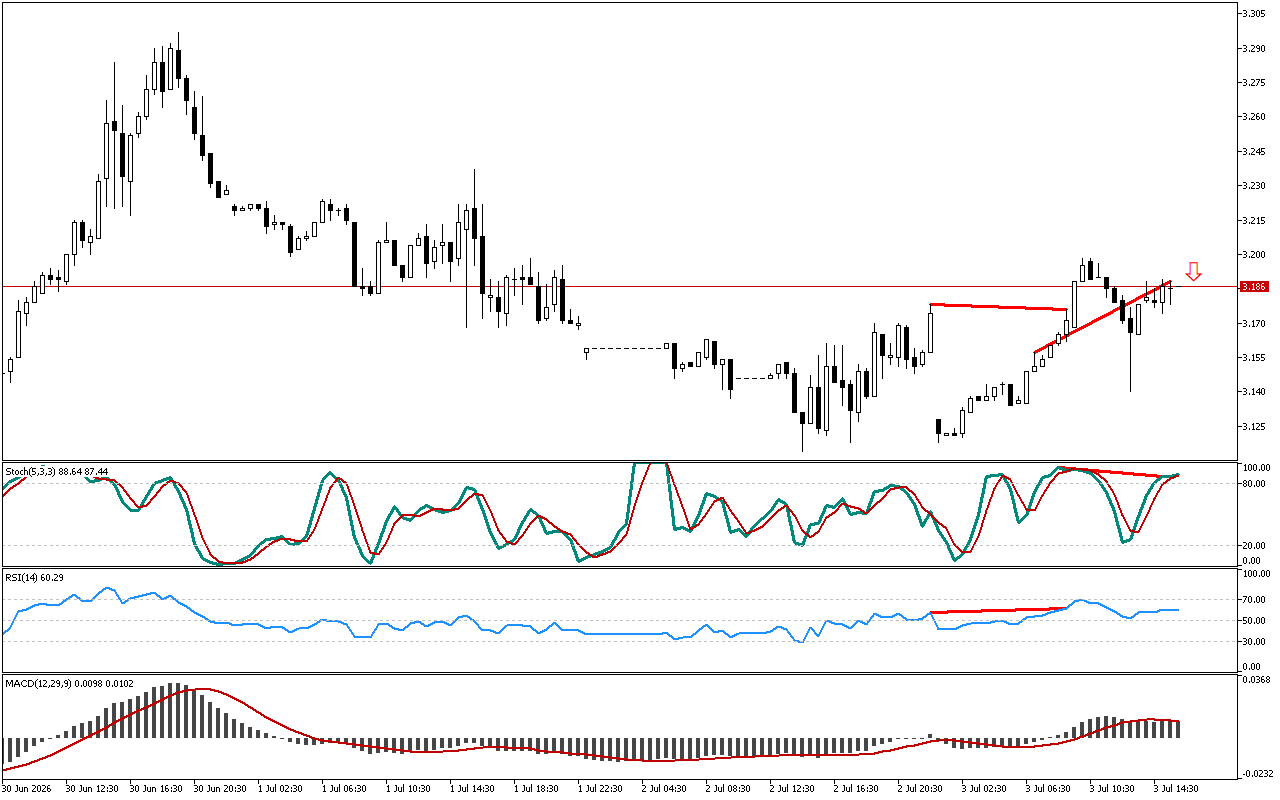
The price failed to form a new high, while the Stochastic indicator remains above the 20 level. This divergence, marked…
Read More