
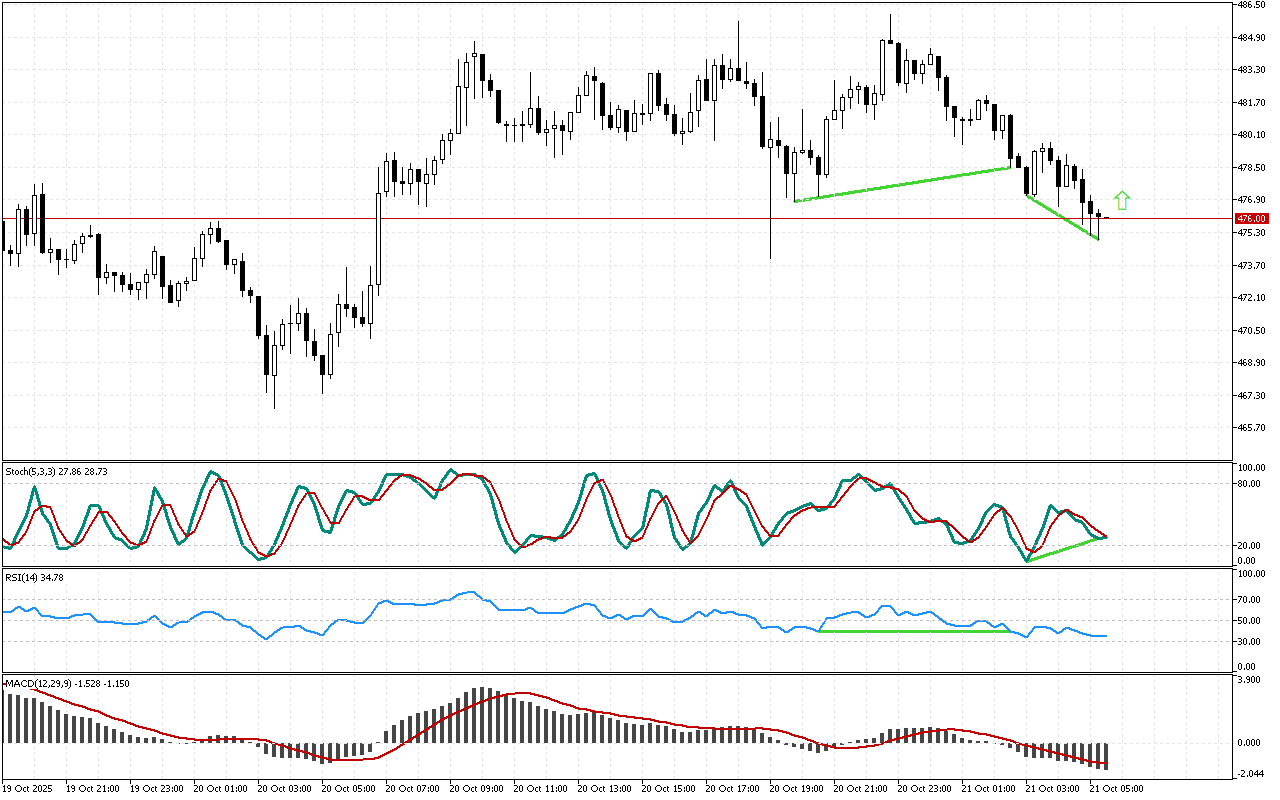
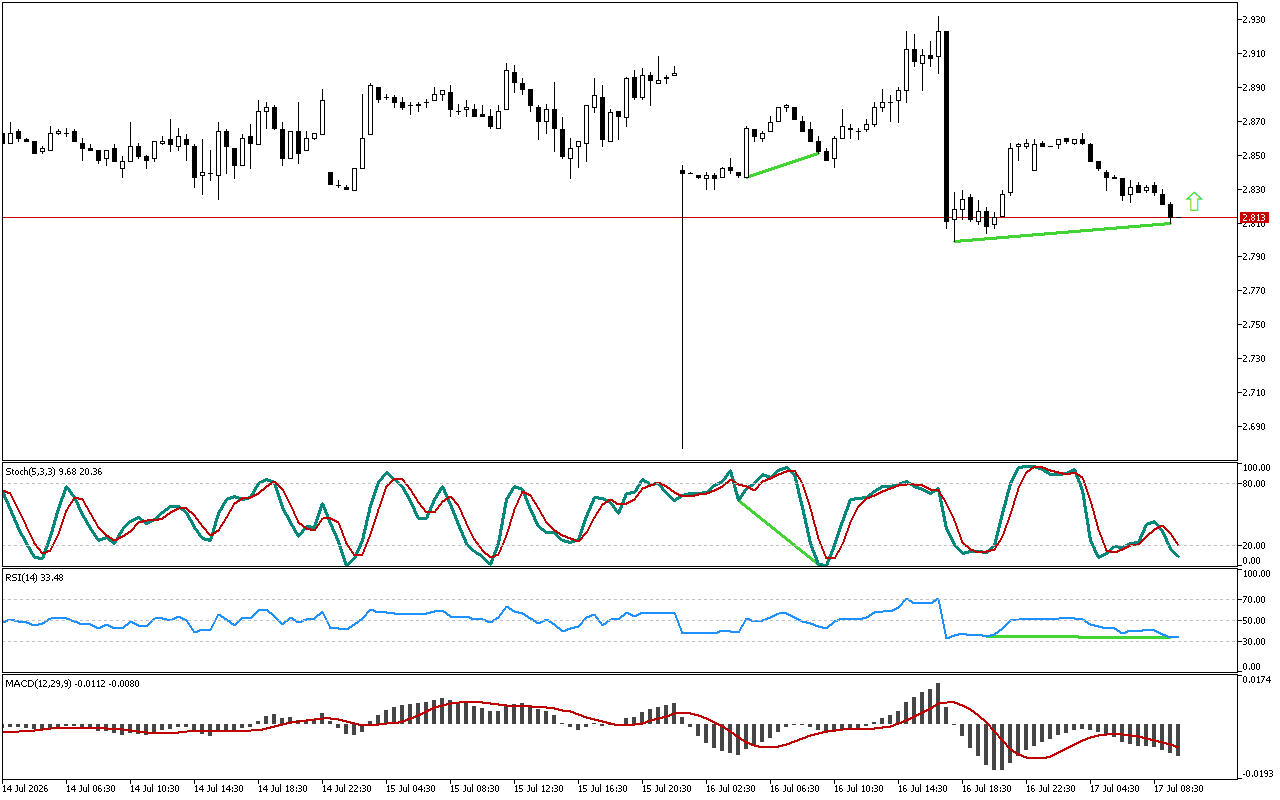
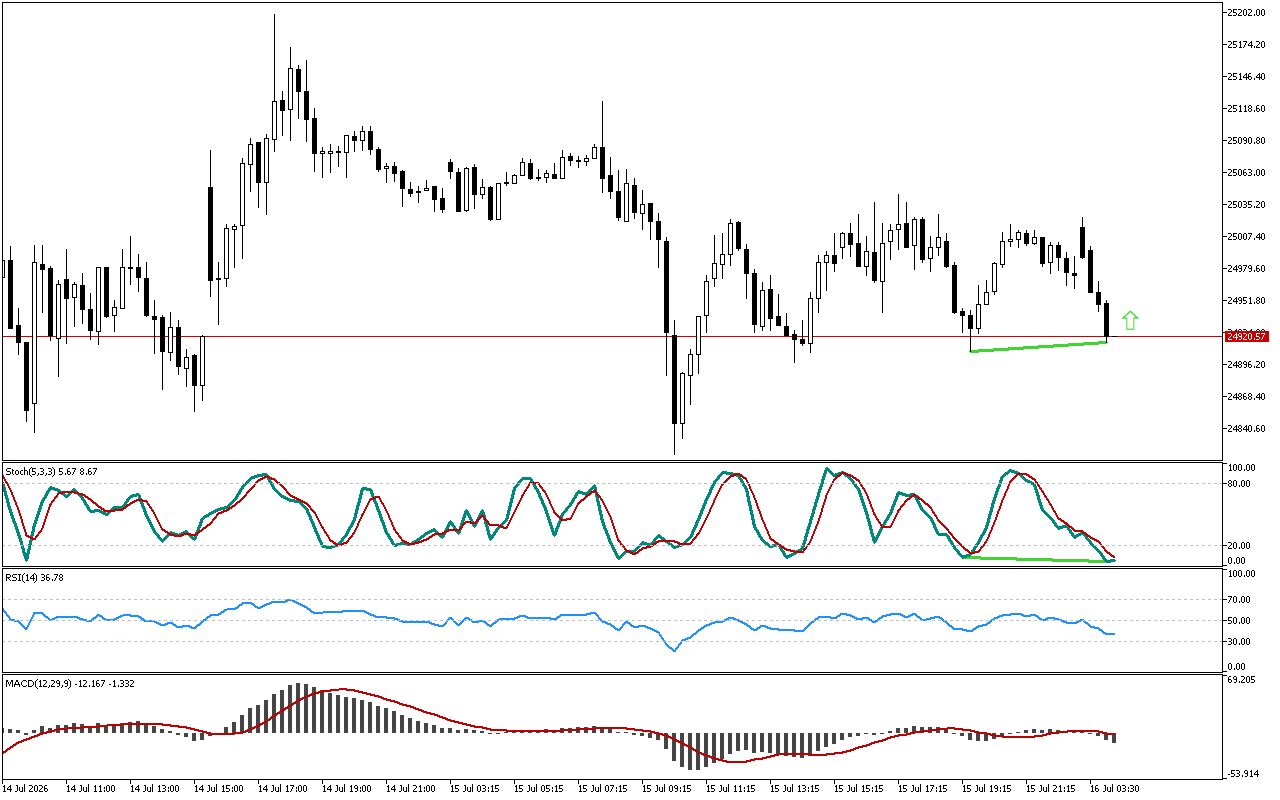
The Bit.Cash maintains an upward direction of movement, while Stochastic has fallen below 20. The formed reverse divergence is marked on the chart with a green line.
Let’s consider the RSI indicator. The reversal signal was detected on this oscillator earlier. The formation of several reversal patterns simultaneously increases the likelihood the received signal is valid for processing.
The MACD histogram is below the signal line. This indicator shows medium- and long-term trends and may ignore short-term price reversals and pullbacks sometimes.
For Bit.Cash now the most evident trading strategy is opening the long positions. A trader can enter the market at the current levels or when a preset level is being retested.
📌 Entry: 476.02
✔️ First target: 481.11
✔️ Second target: 485.33
❌ Stop order: 473.01
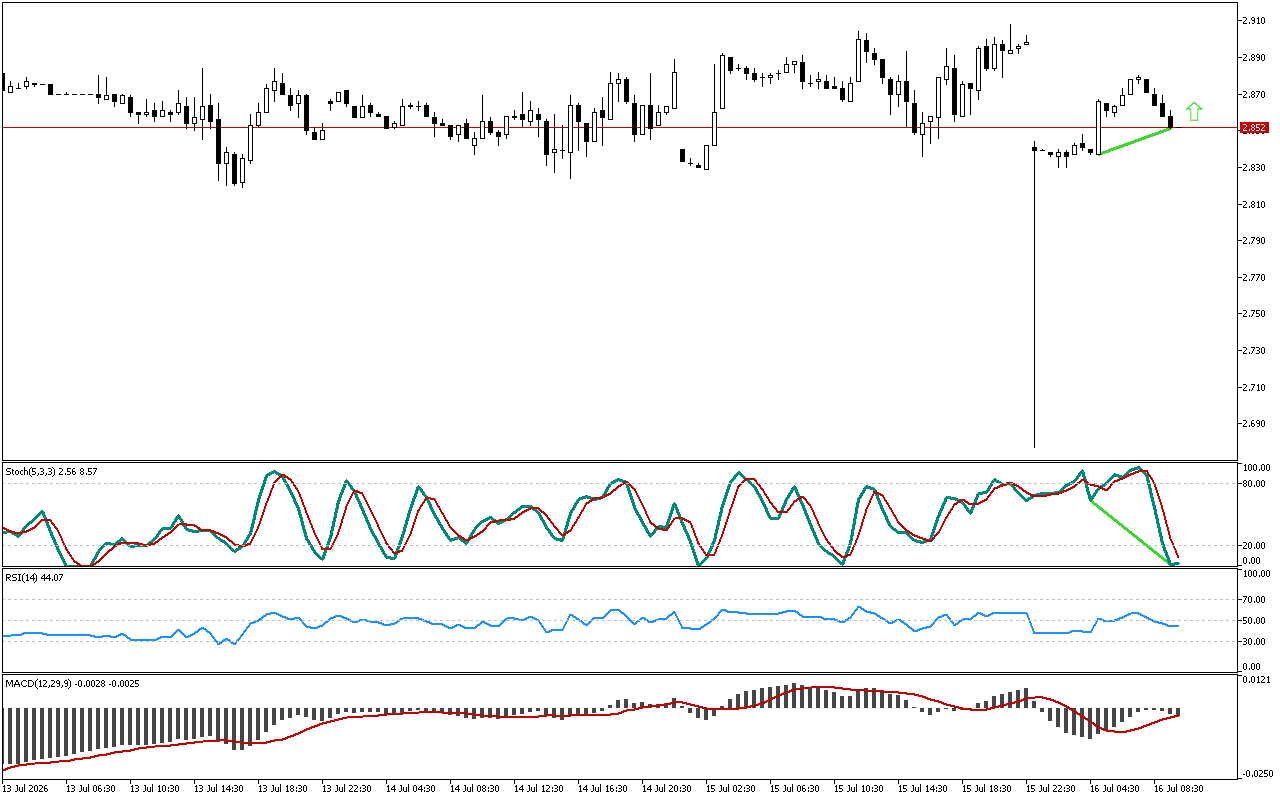
Bit.Cash M15: Divergence at the Stochastic strengthens the reversal signal received earlier from the RSI
Leave a Reply