
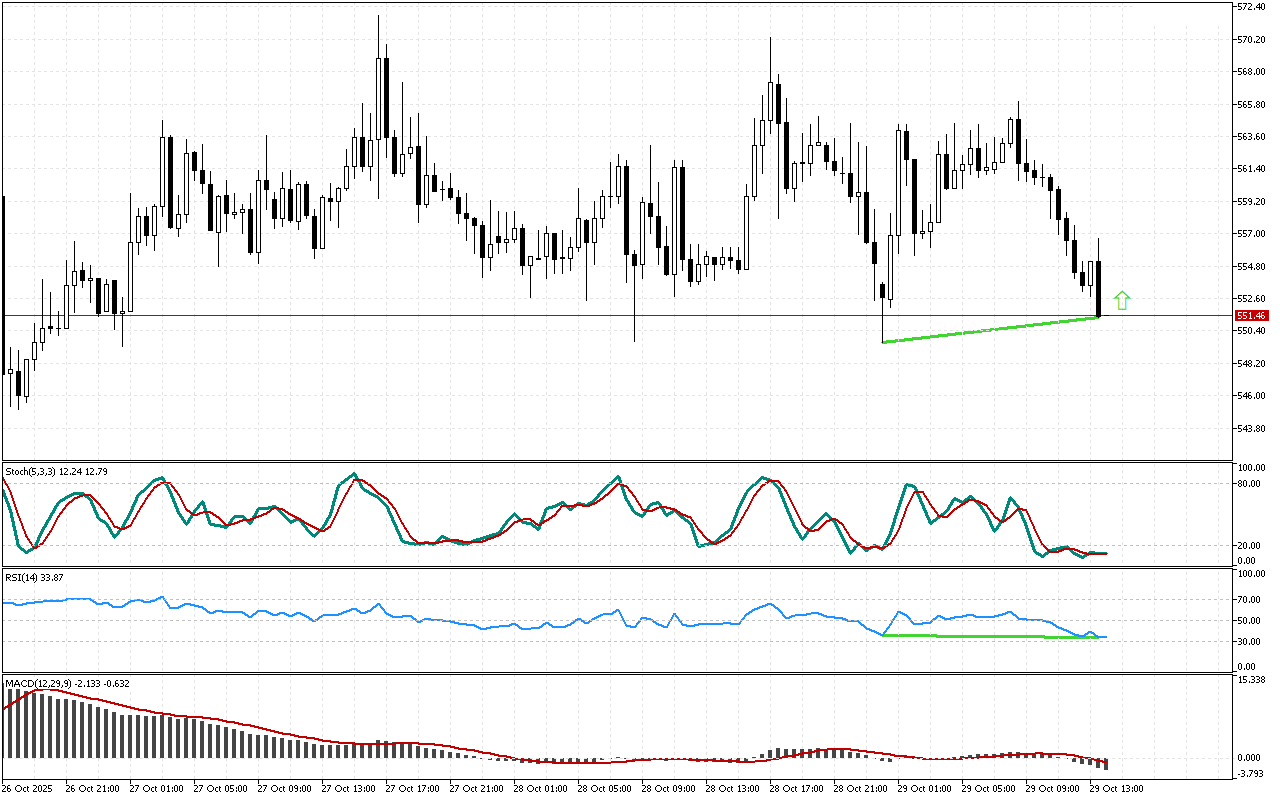
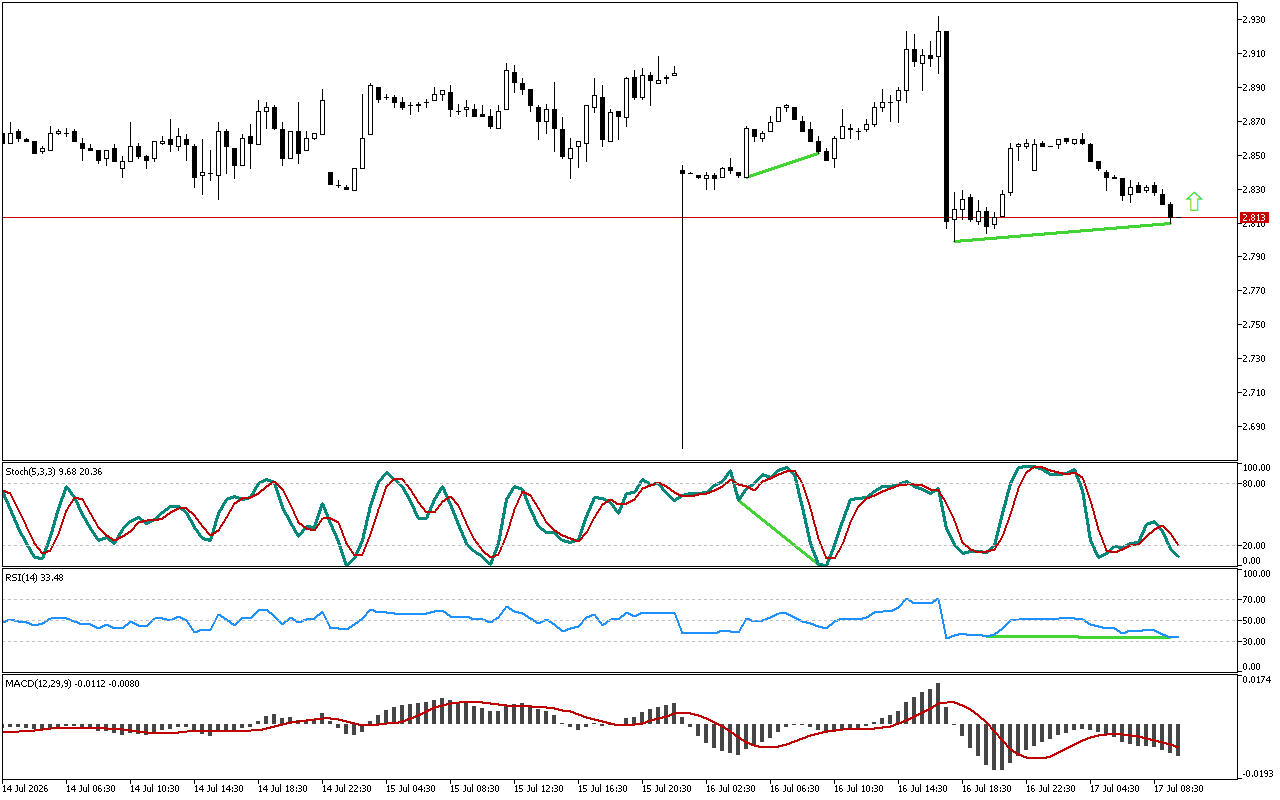
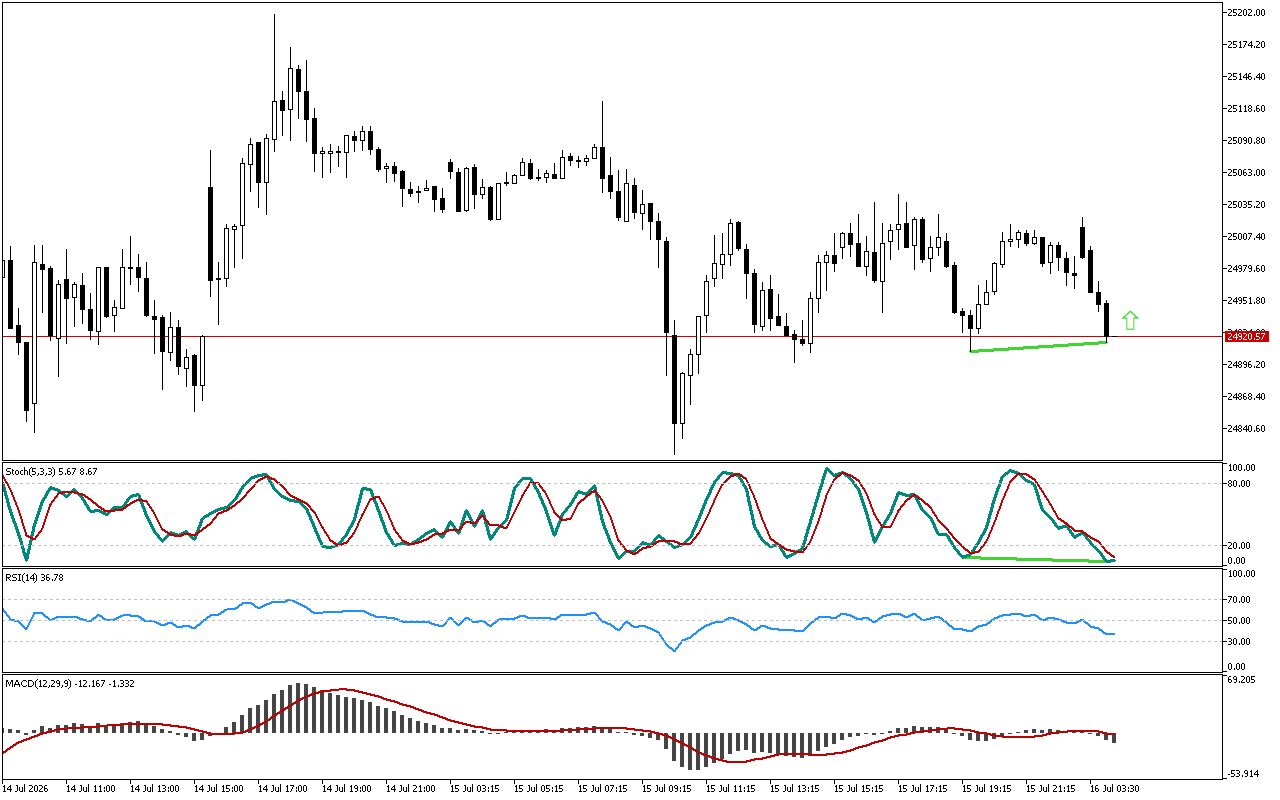
The price failed to reach a new low, while the RSI indicator shows an upward trend. The formed reverse divergence could signal a potential price reversal upward.
The MACD histogram is below the signal line. This indicator shows medium- and long-term trends and may ignore short-term price reversals and pullbacks sometimes.
There is the blue main line above the red signal line on the Stochastic indicator. The reversal pattern has not formed yet.
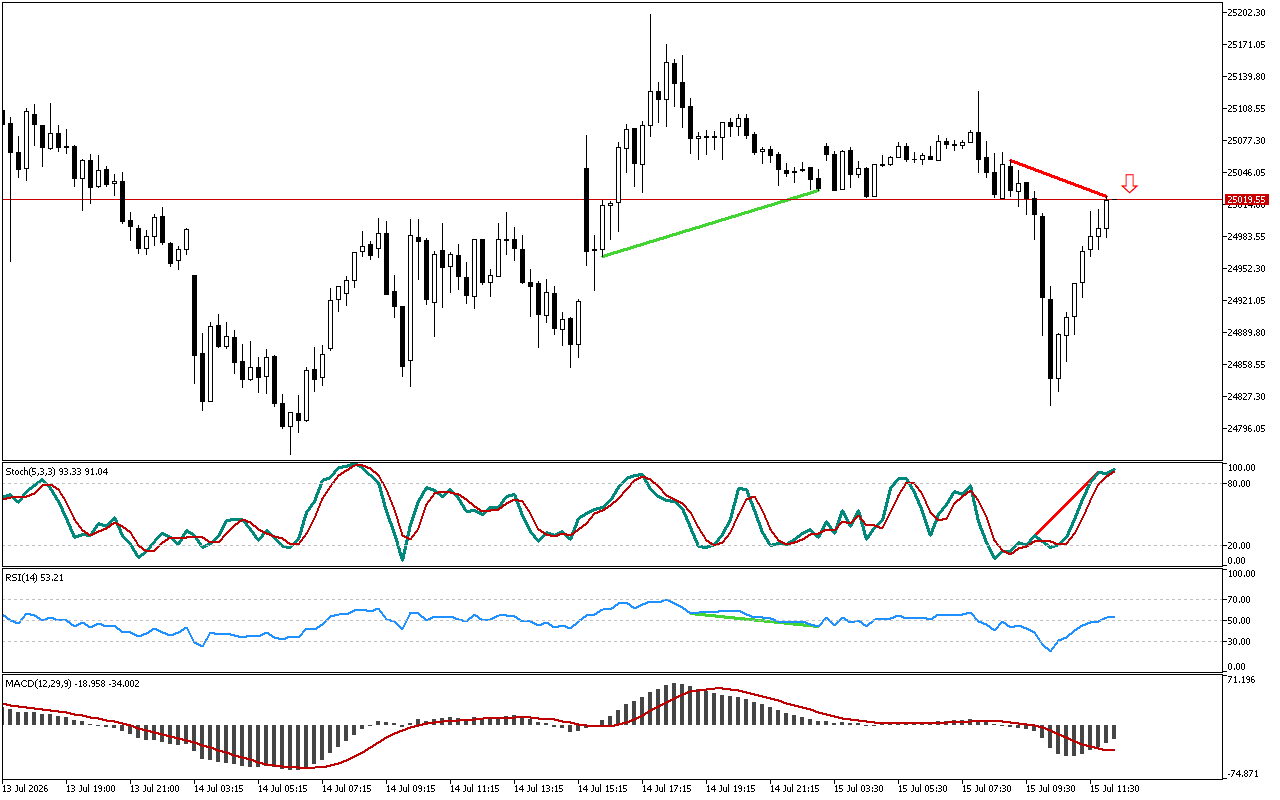
It is recommended to prioritize long positions on Bit.Cash in the current situation. Entry points can be selected both at current prices and based on an outcome of a retest of the specified resistance level.
📌 Entry: 551.48
✔️ First target: 565.99
✔️ Second target: 575.97
❌ Stop order: 543.14
Bit.Cash M30: RSI signals a possible upward reversal
Leave a Reply