
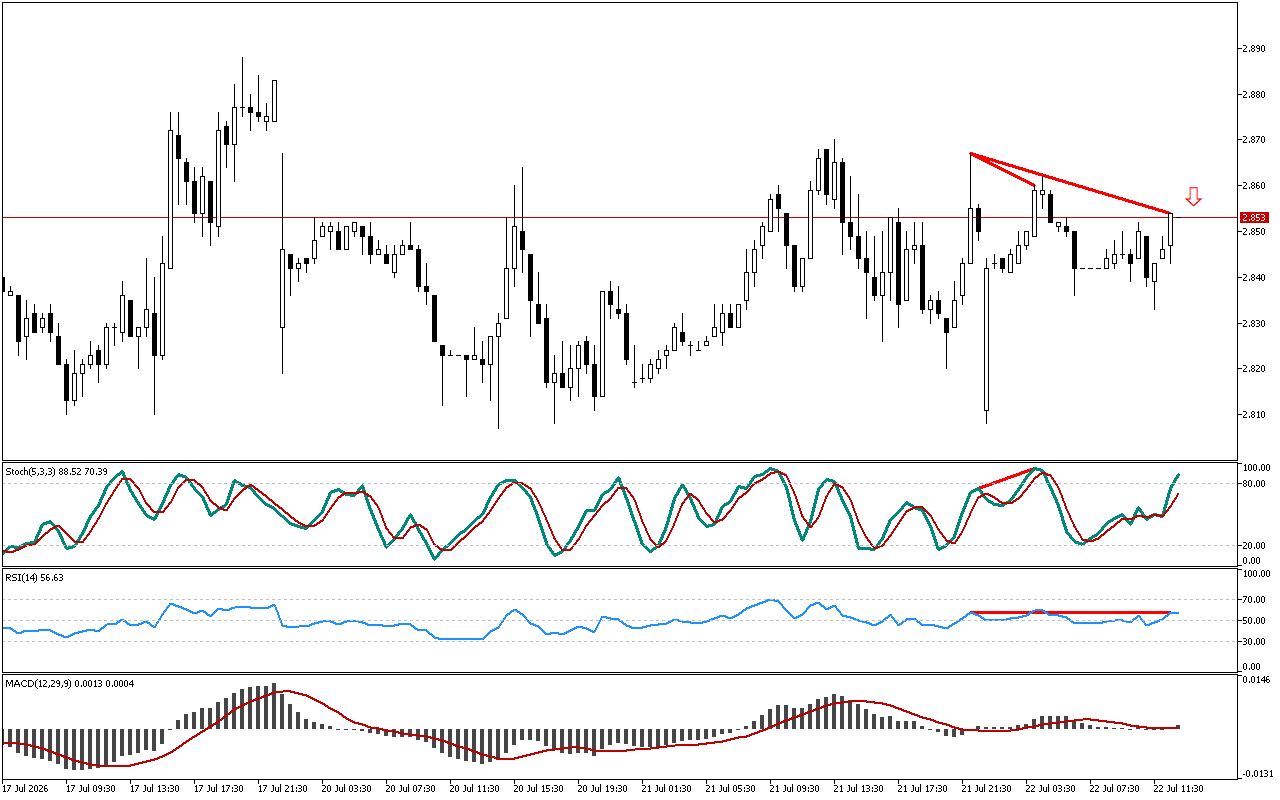
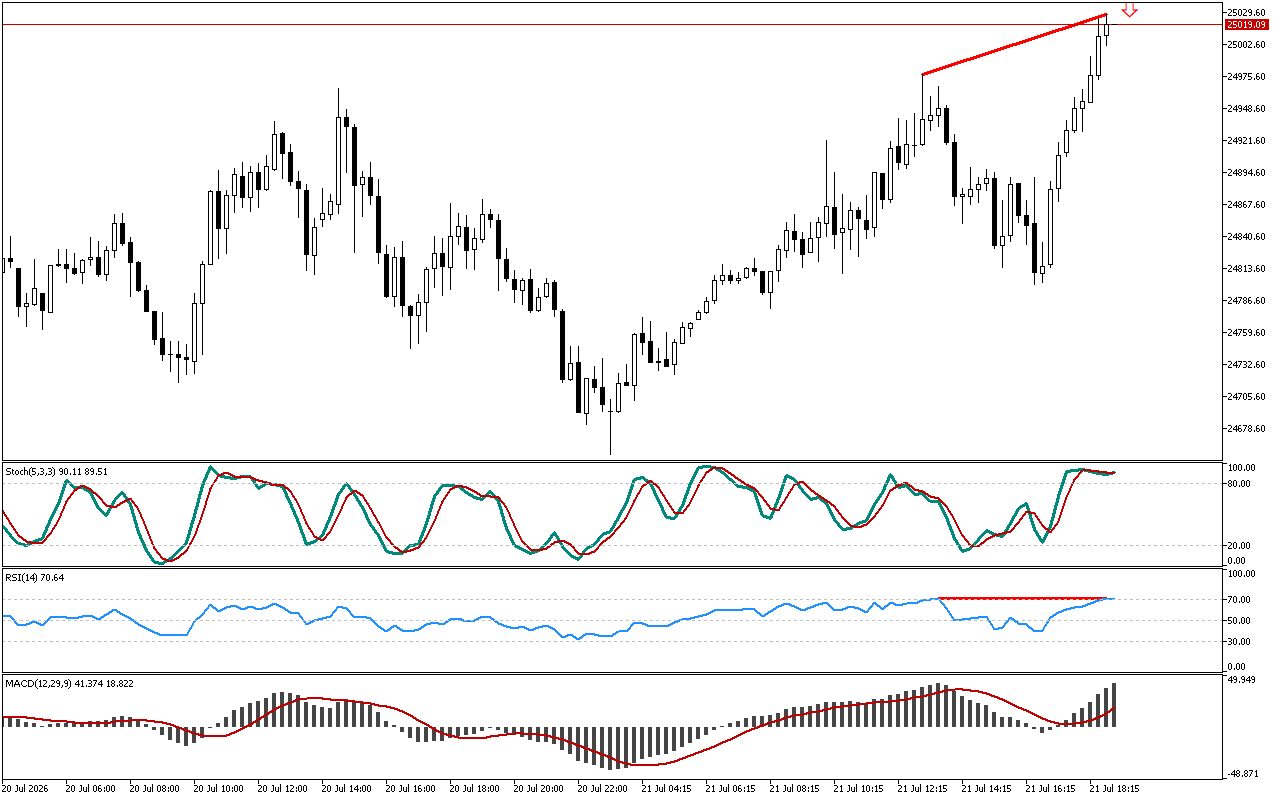
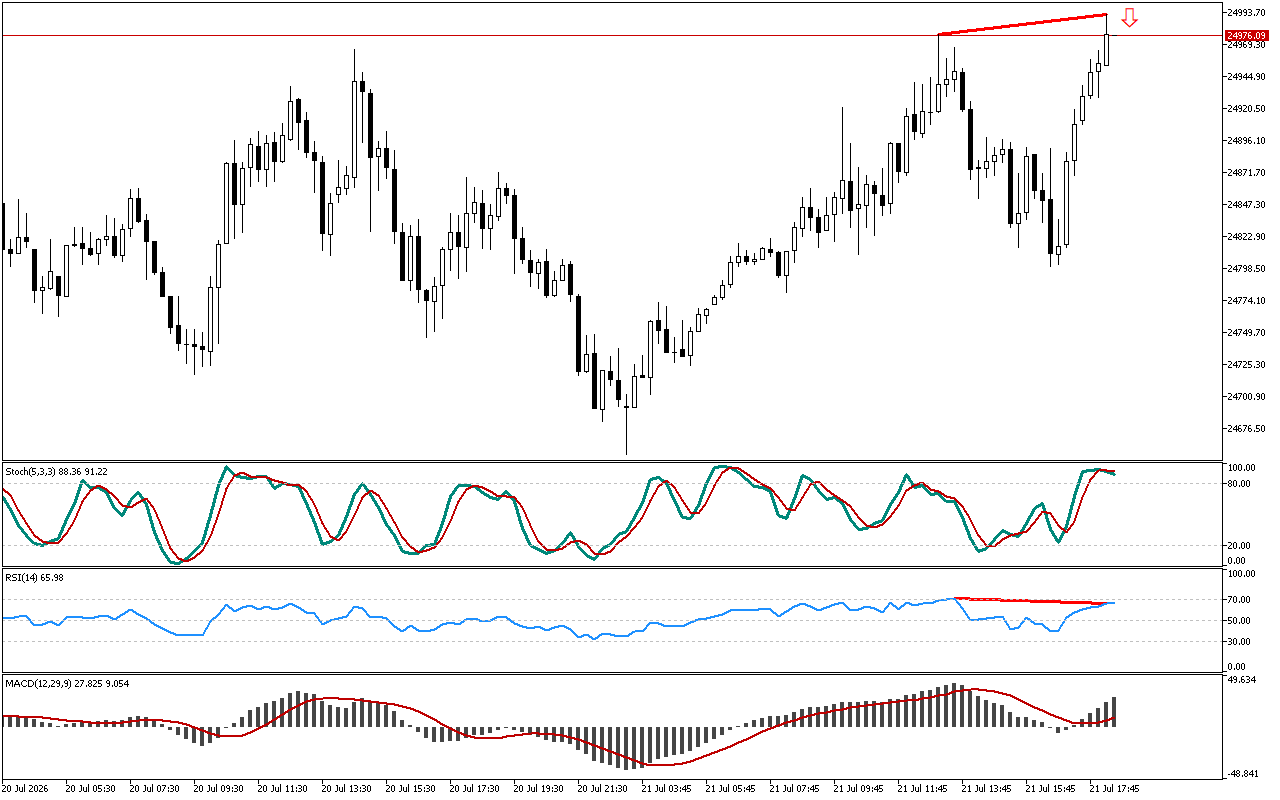
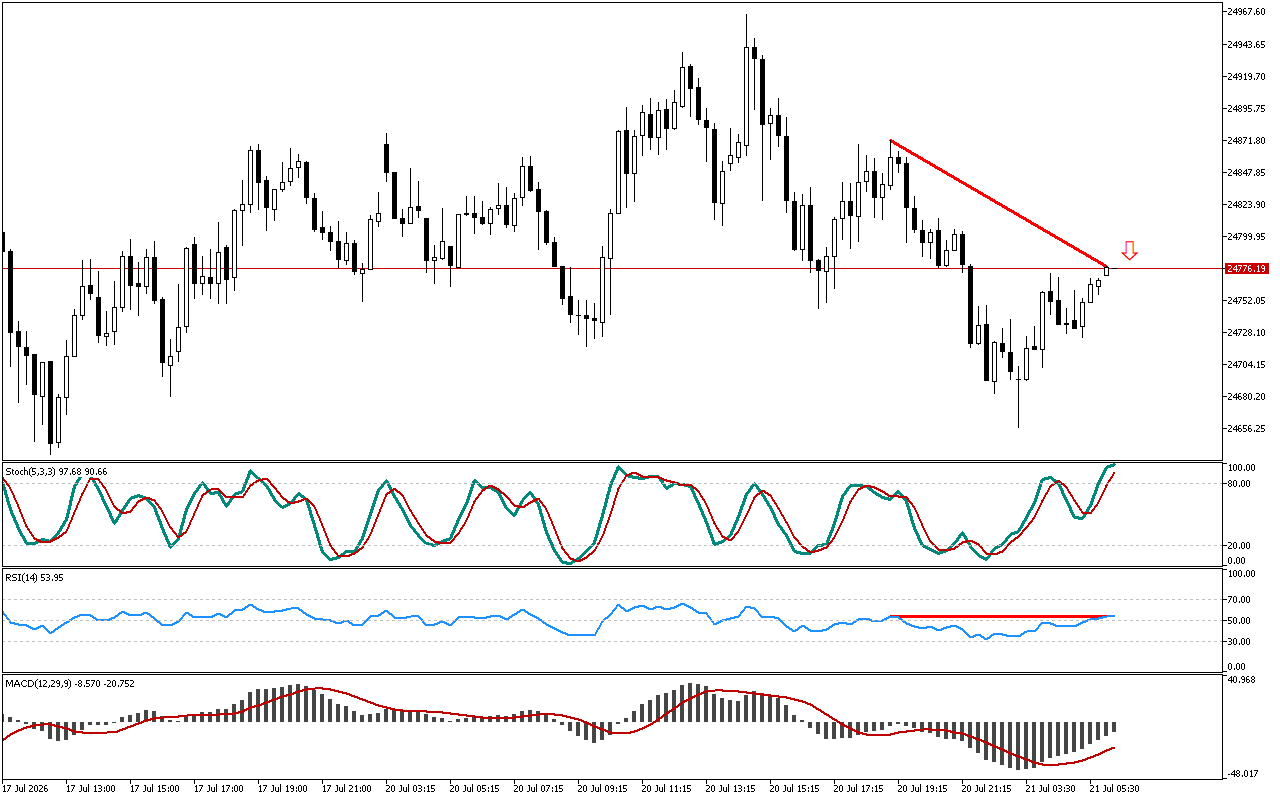
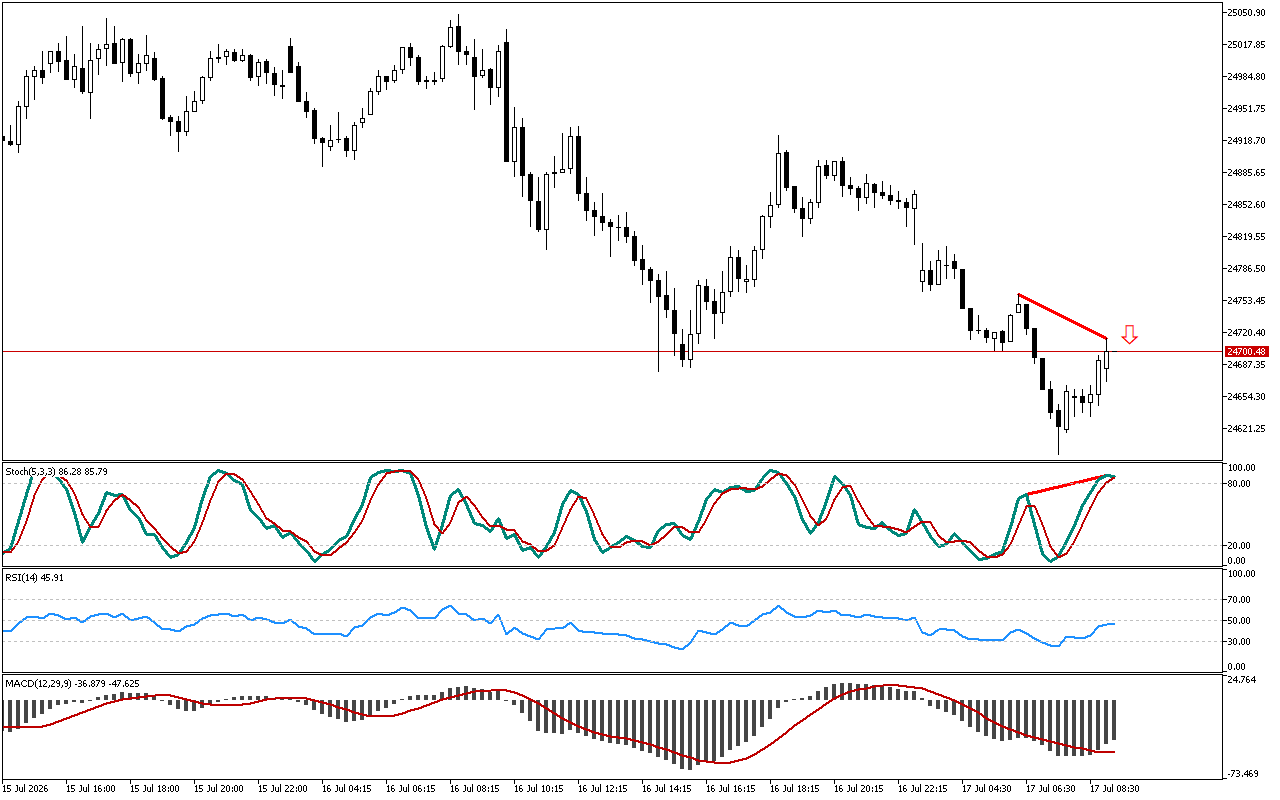
The RSI oscillator detects a discrepancy. The price failed to reach a new peak, while the RSI indicator rose above the previous intraday high, indicating a potential change in price movement dynamics.
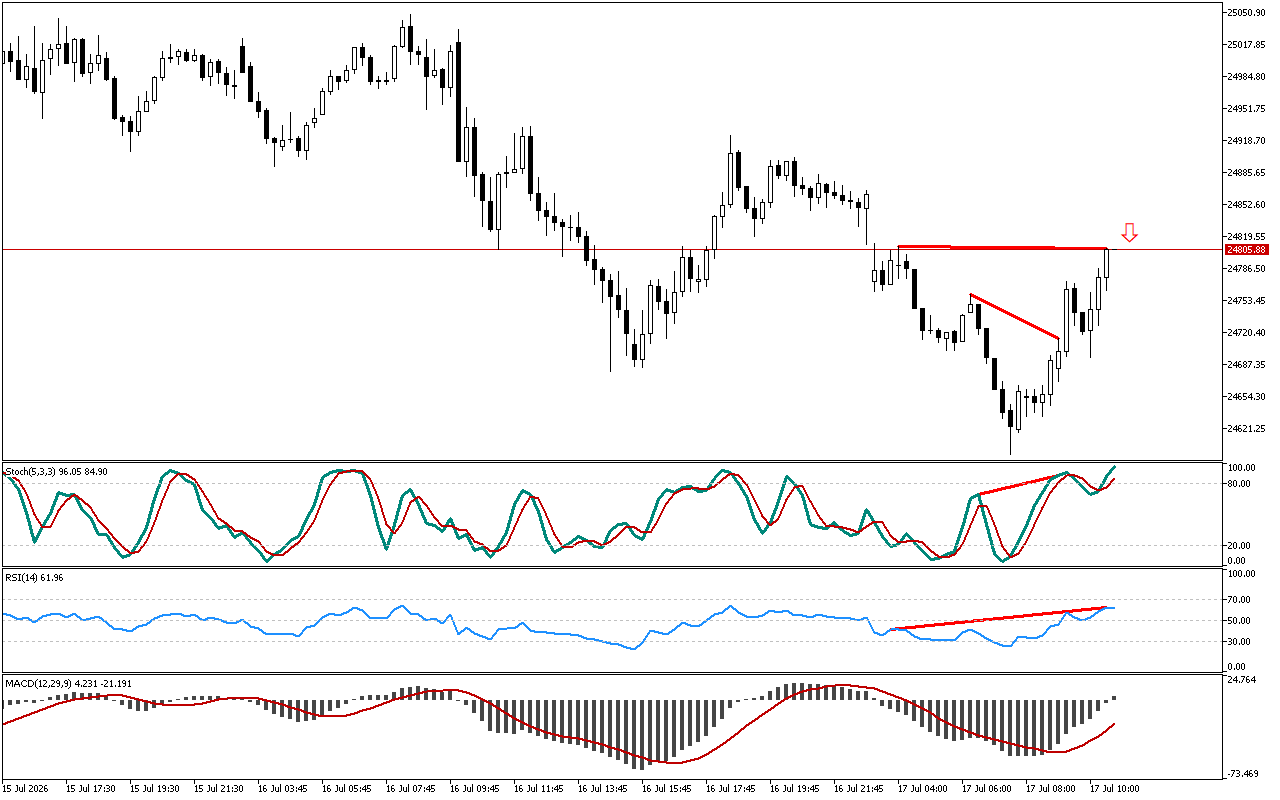
The MACD histogram is below the signal line. This indicator shows medium- and long-term trends and may ignore short-term price reversals and pullbacks sometimes.
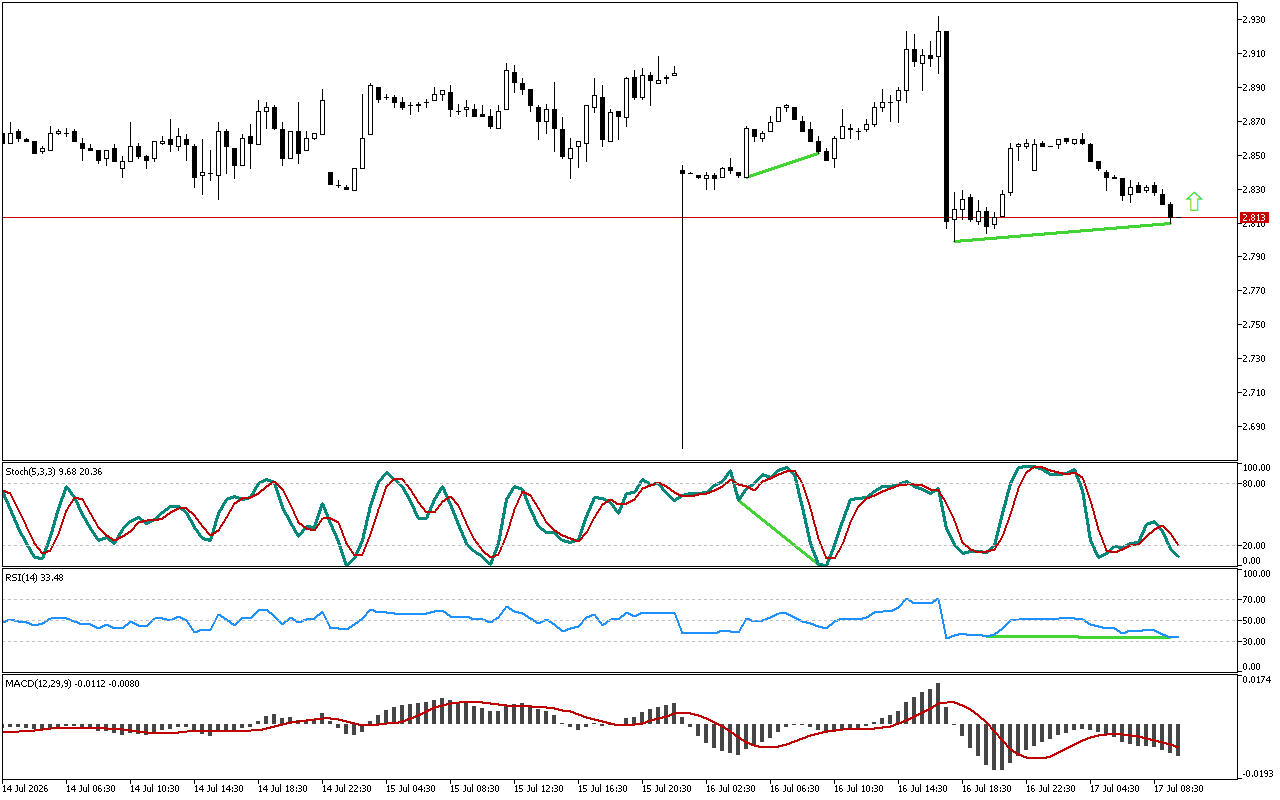
There is the blue main line above the red signal line on the Stochastic indicator. The reversal pattern has not formed yet.
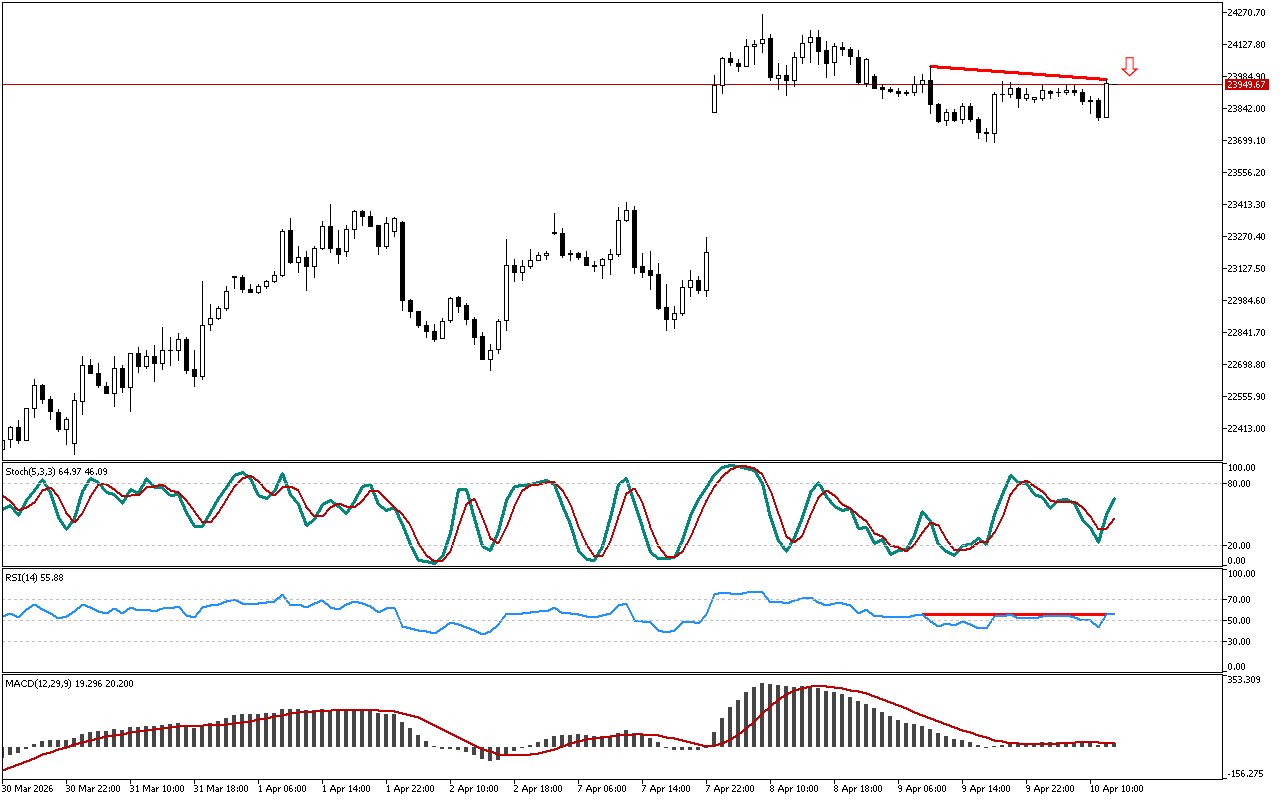
Thus, in terms of DAX 40, preference should be given to short positions. A trader can enter the market at or around the current prices or when the resistance level is retested.
📌 Entry: 23949.67
✔️ First target: 23691.39
✔️ Second target: 23447.27
❌ Stop order: 24120.47
DAX 40 H1: The downward divergence from RSI
Leave a Reply