
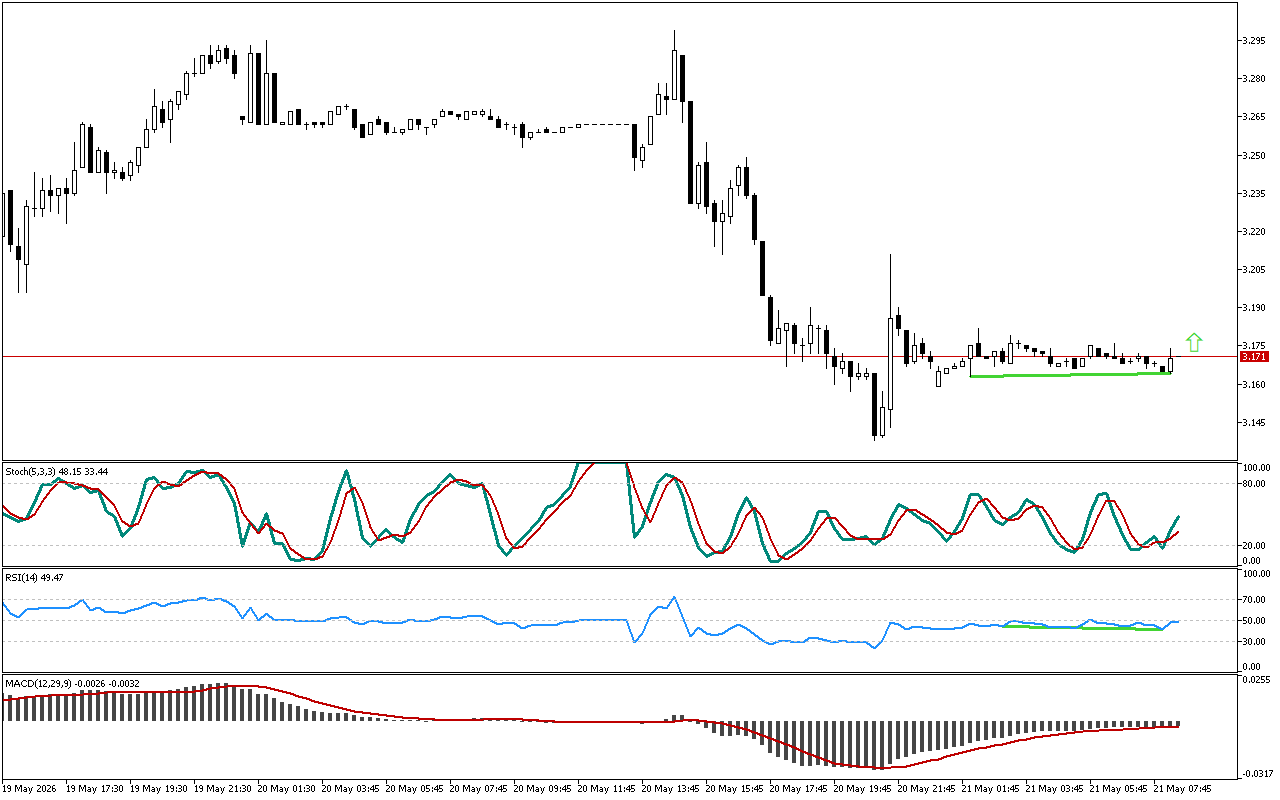
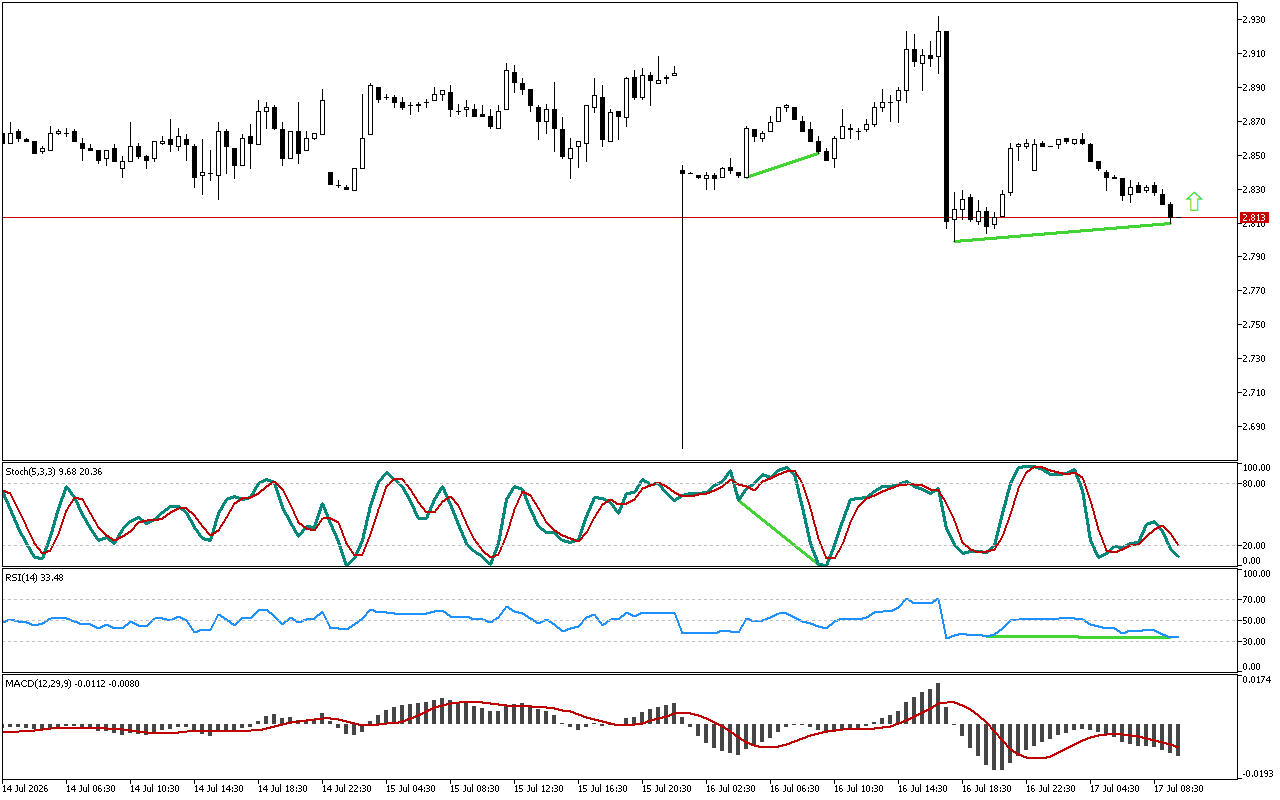
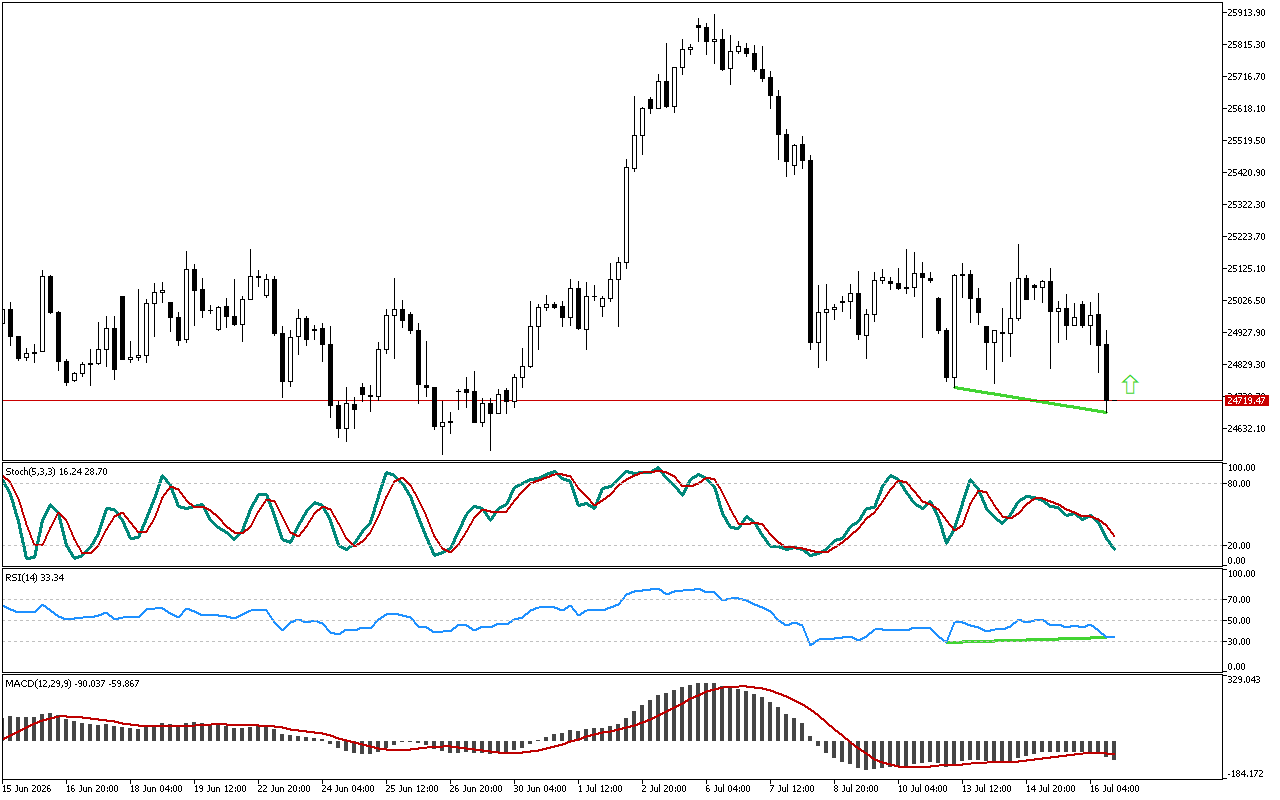
The price failed to reach a new low, while the RSI indicator shows an upward trend. The formed reverse divergence could signal a potential price reversal upward.
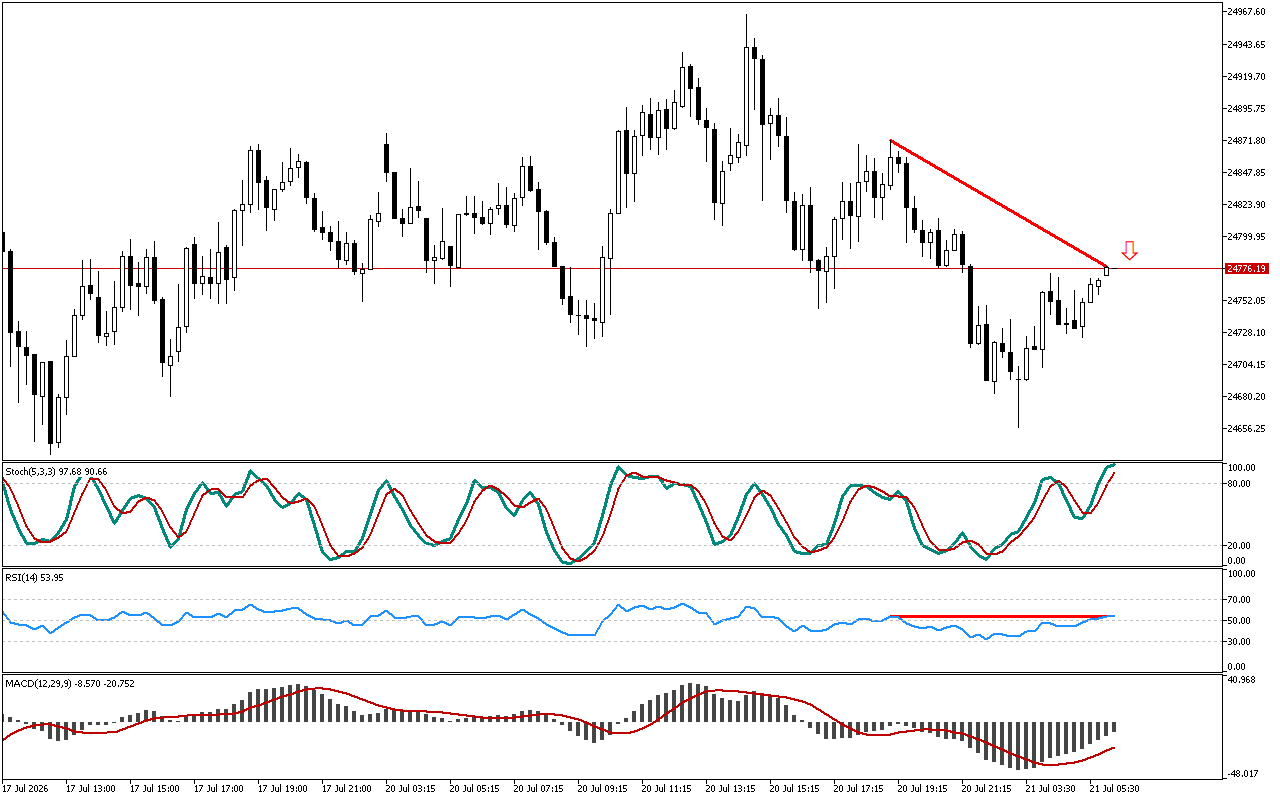
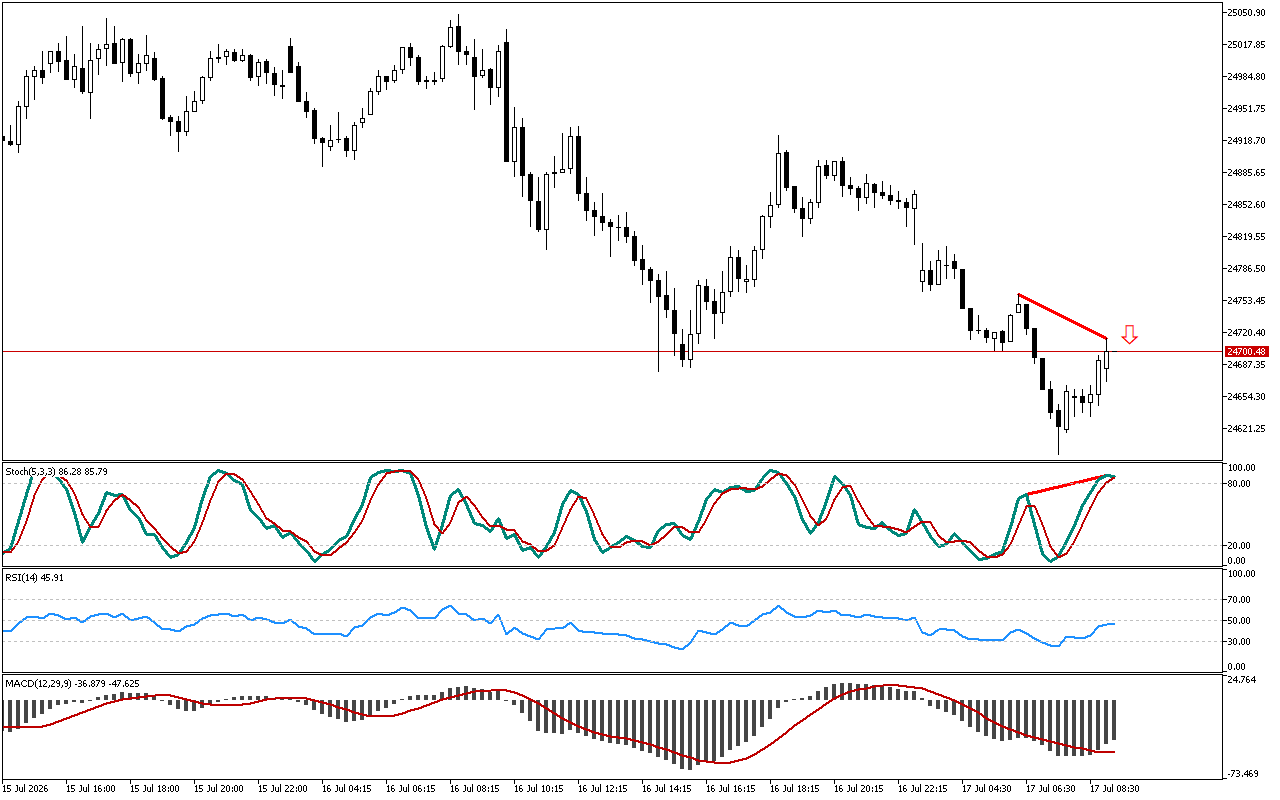
The histogram of the MACD indicator remains above the signal line, indicating the local development of an upward movement. However, the indicator indications do not contradict the signal, marked on the chart.
There is the blue main line above the red signal line on the Stochastic indicator. The reversal pattern has not formed yet.
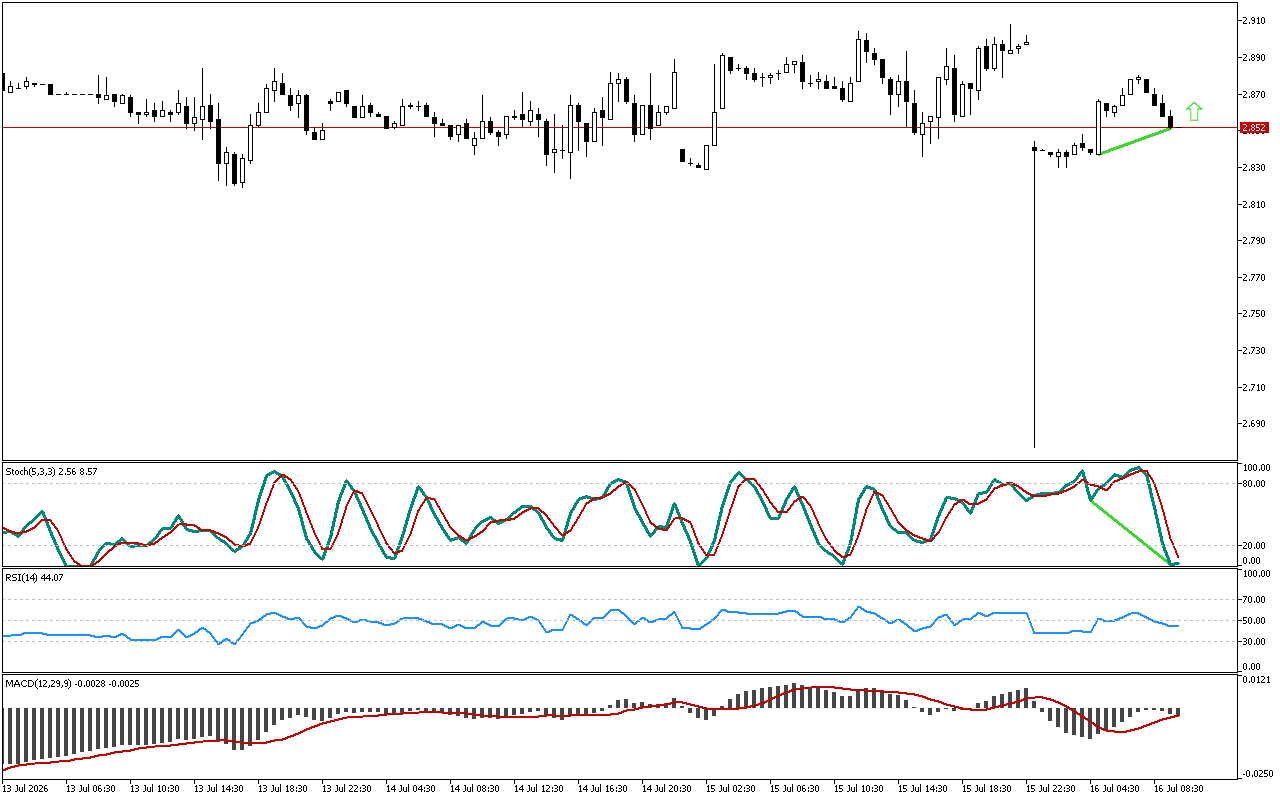
On this timeframe for Natural Gas it is preferable to open long positions.
📌 Entry: 3.171
✔️ First target: 3.182
✔️ Second target: 3.199
❌ Stop order: 3.160
Natural Gas M15: RSI signals a possible upward reversal
Leave a Reply