

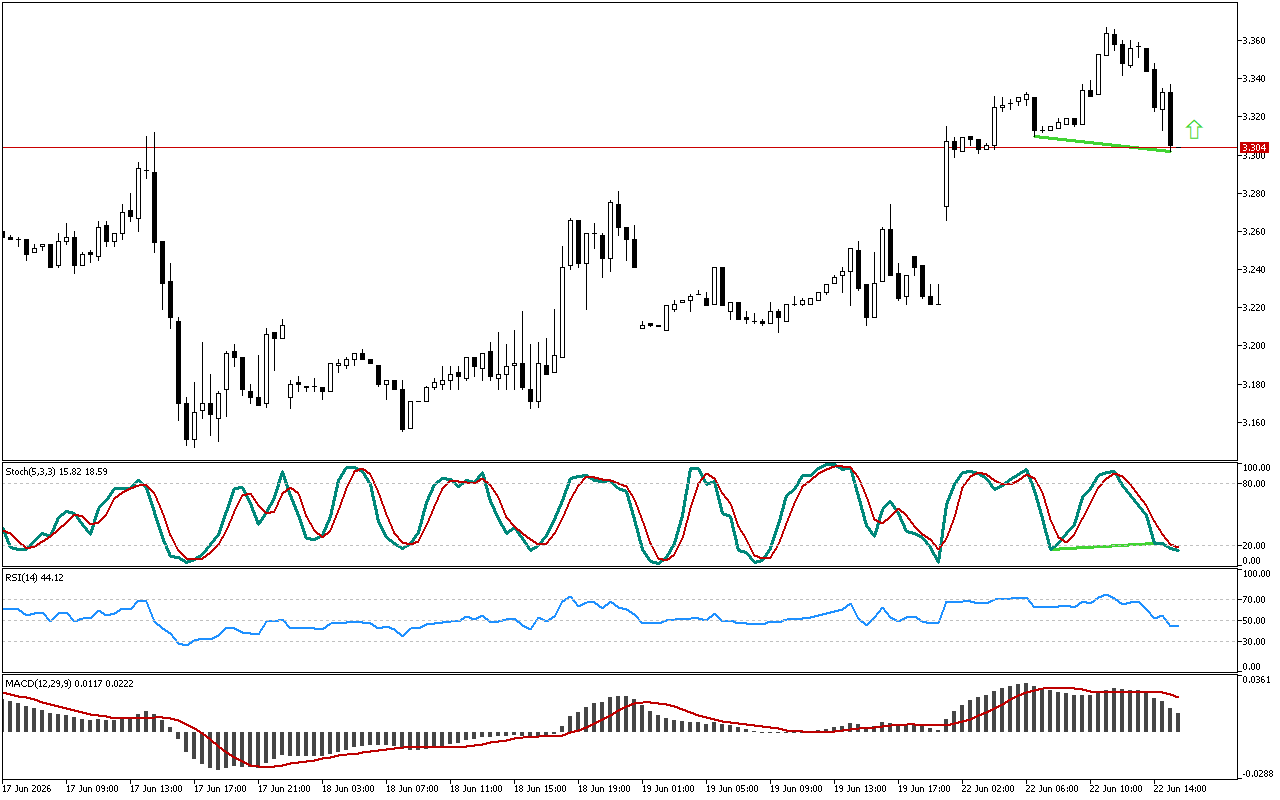
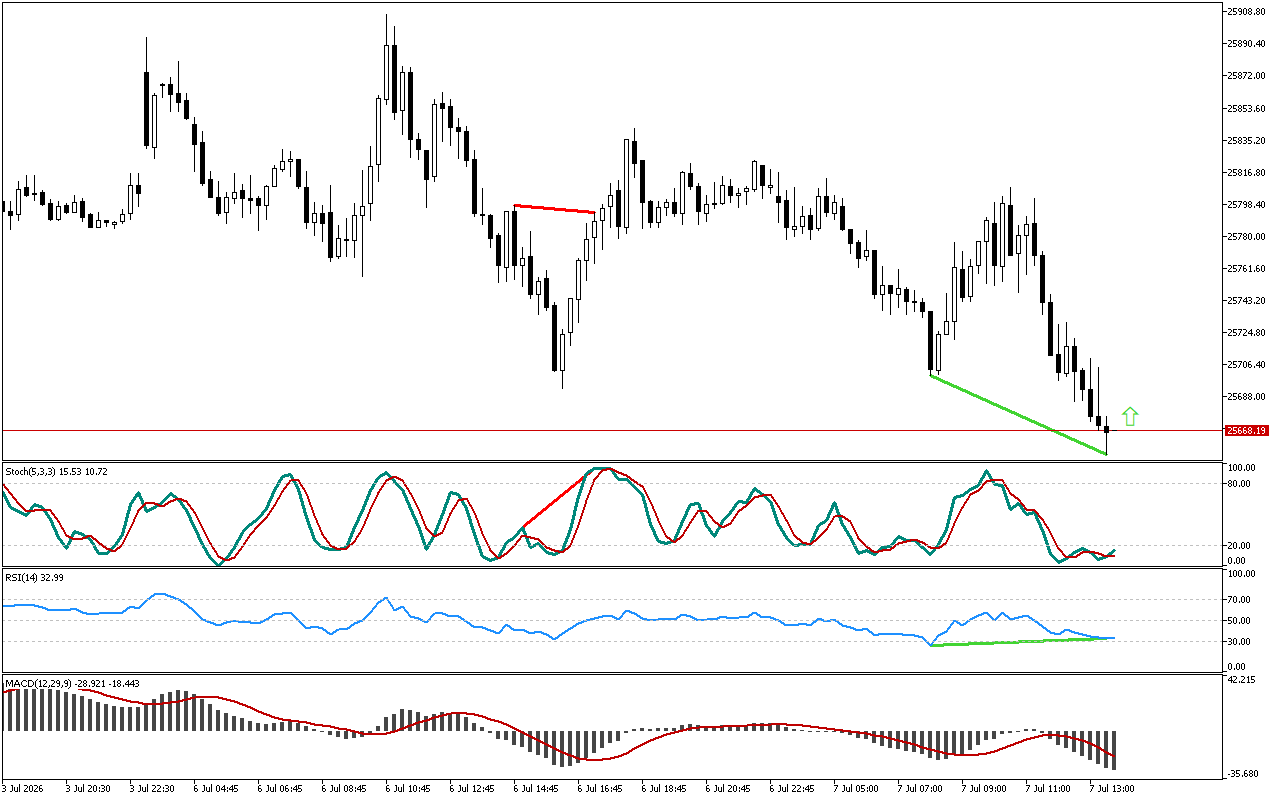
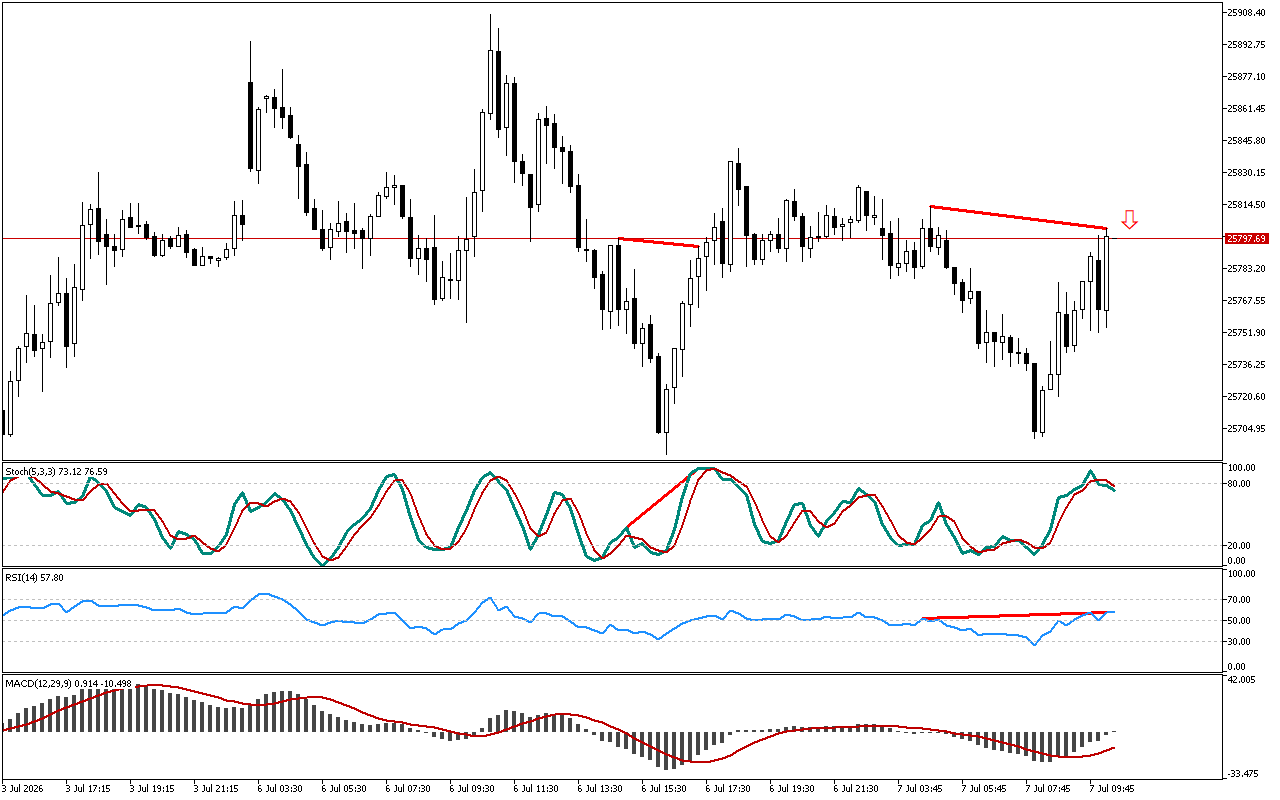
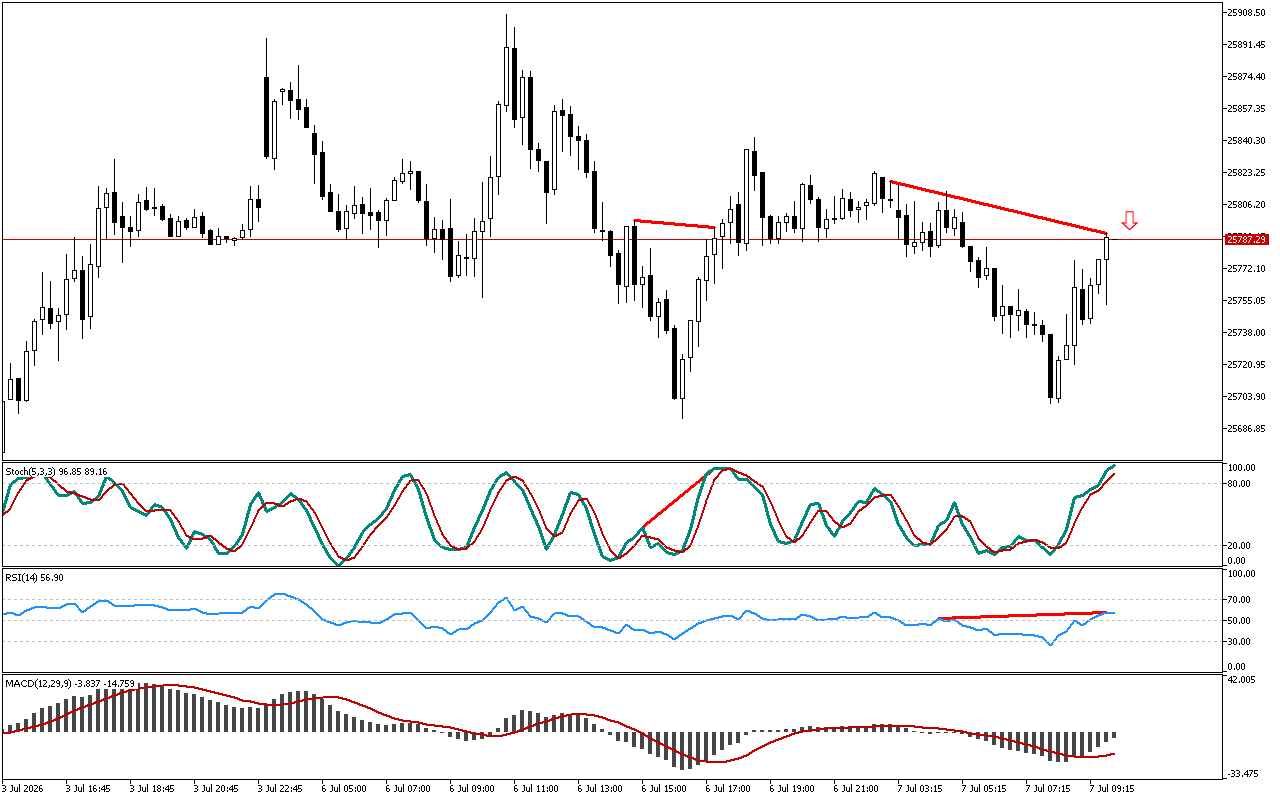
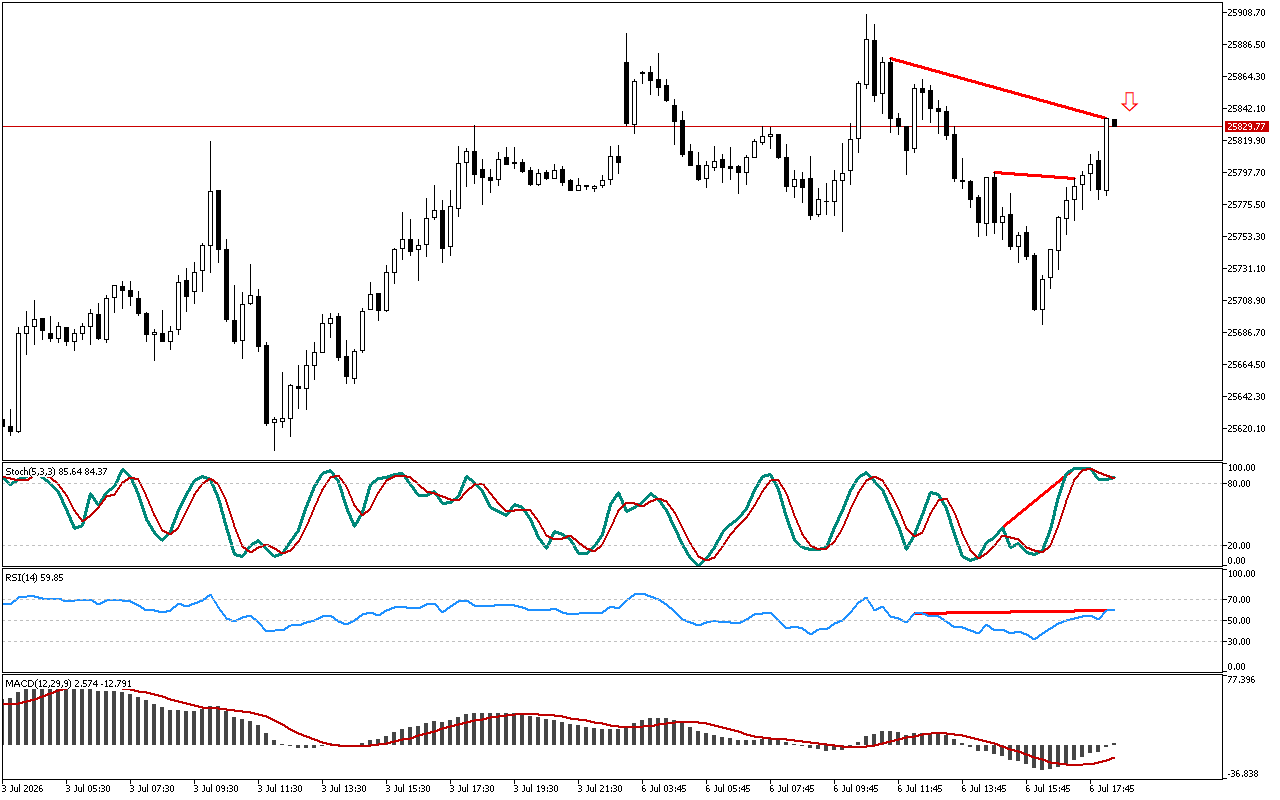
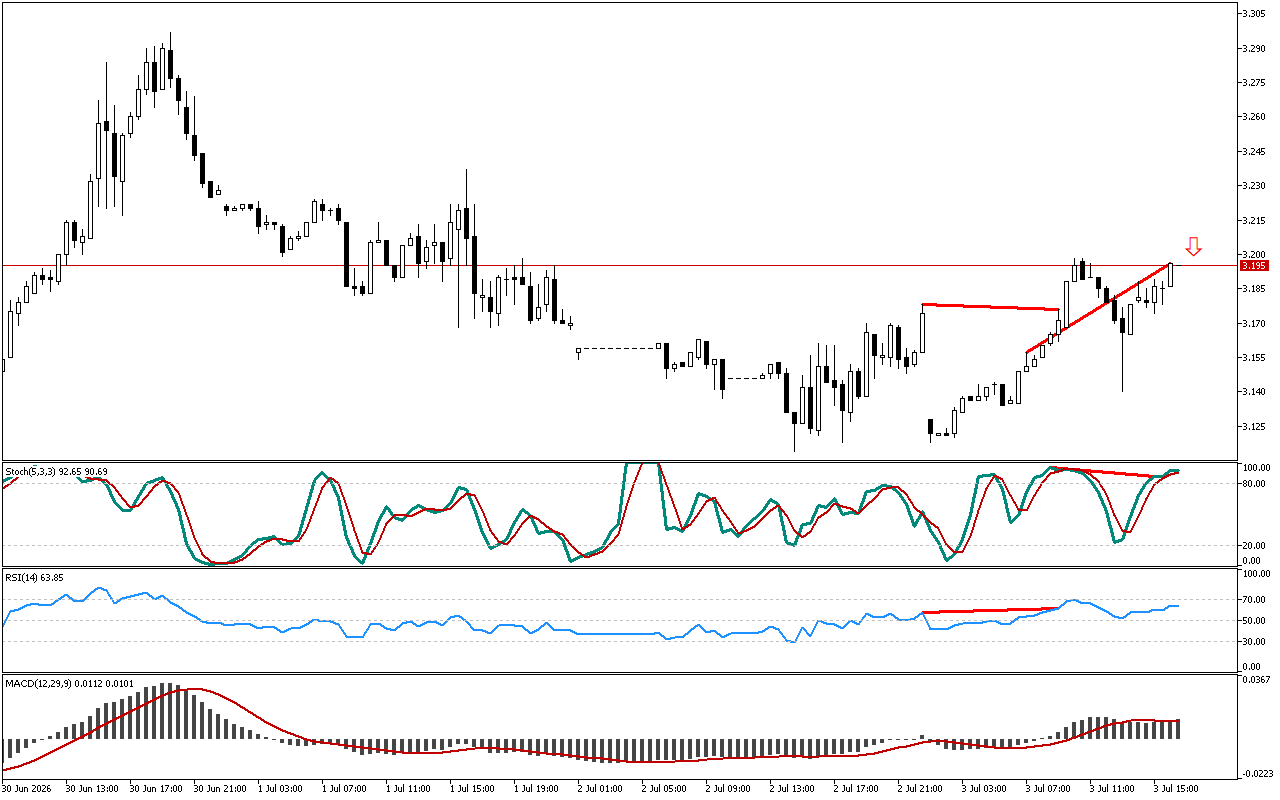
The Natural Gas maintains an upward direction of movement, while Stochastic has fallen below 20. The formed reverse divergence is marked on the chart with a green line.
The RSI indicator is now below the mark of 50. The position of the indicator below this level indicates the predominance of a downward trend.
The MACD histogram is below the signal line. This indicator shows medium- and long-term trends and may ignore short-term price reversals and pullbacks sometimes.
The chart shows, that it might be strategically more profitable to open long positions in Natural Gas.
📌 Entry: 3.304
✔️ First target: 3.367
✔️ Second target: 3.403
❌ Stop order: 3.272
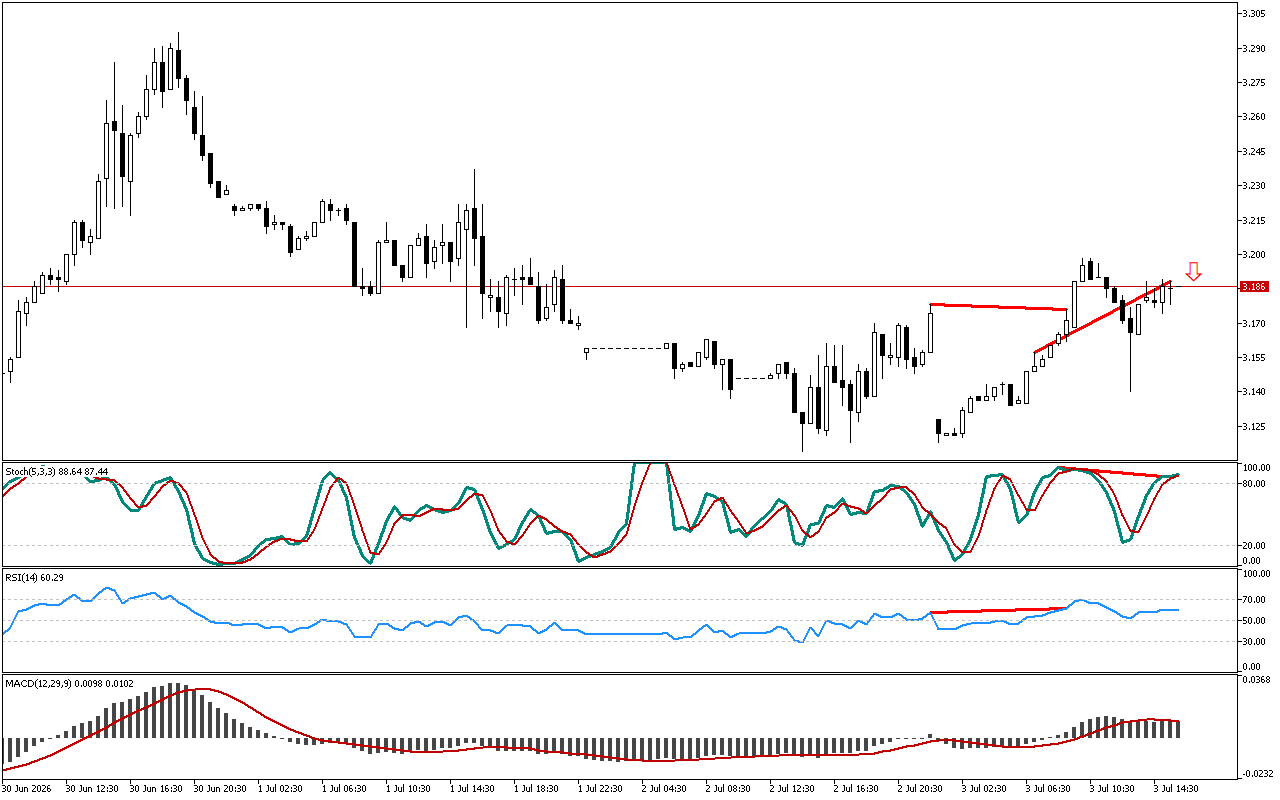
Natural Gas M30: Divergence signal is received from the Stochastic
Leave a Reply