

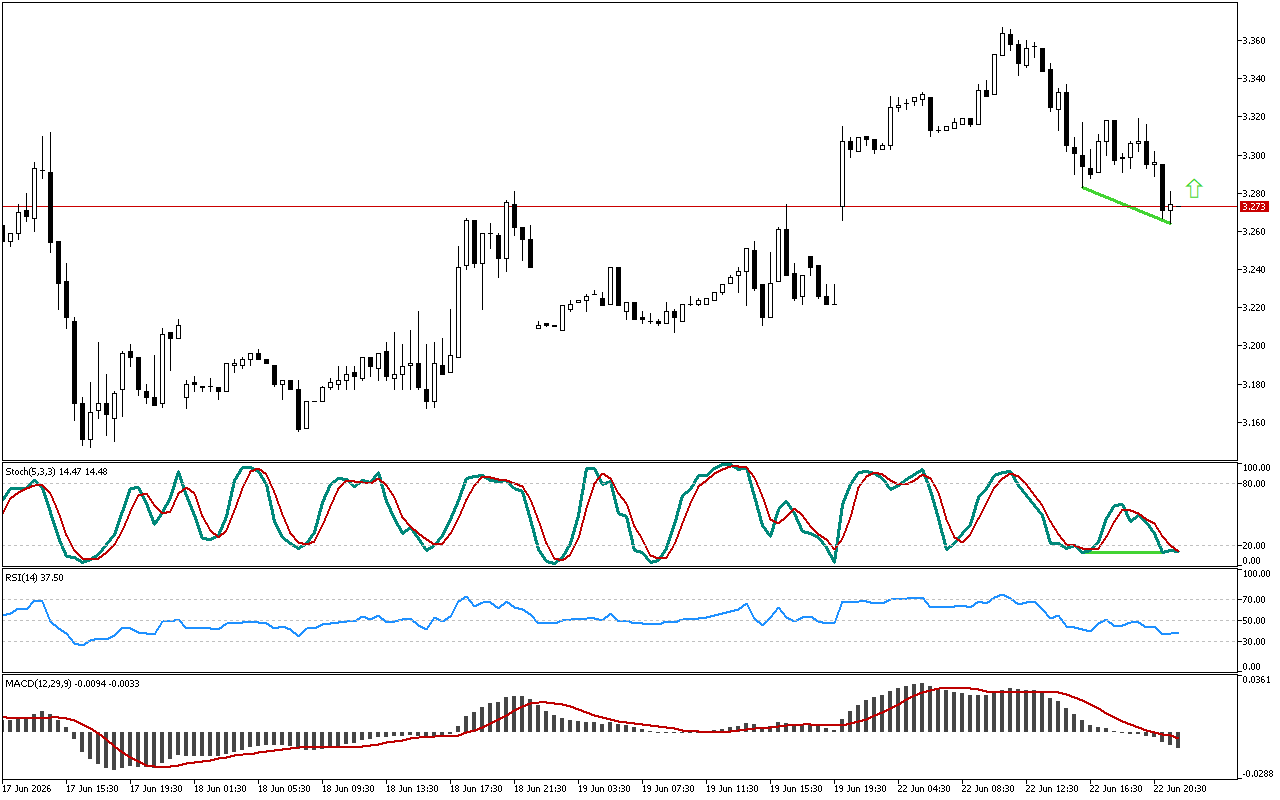
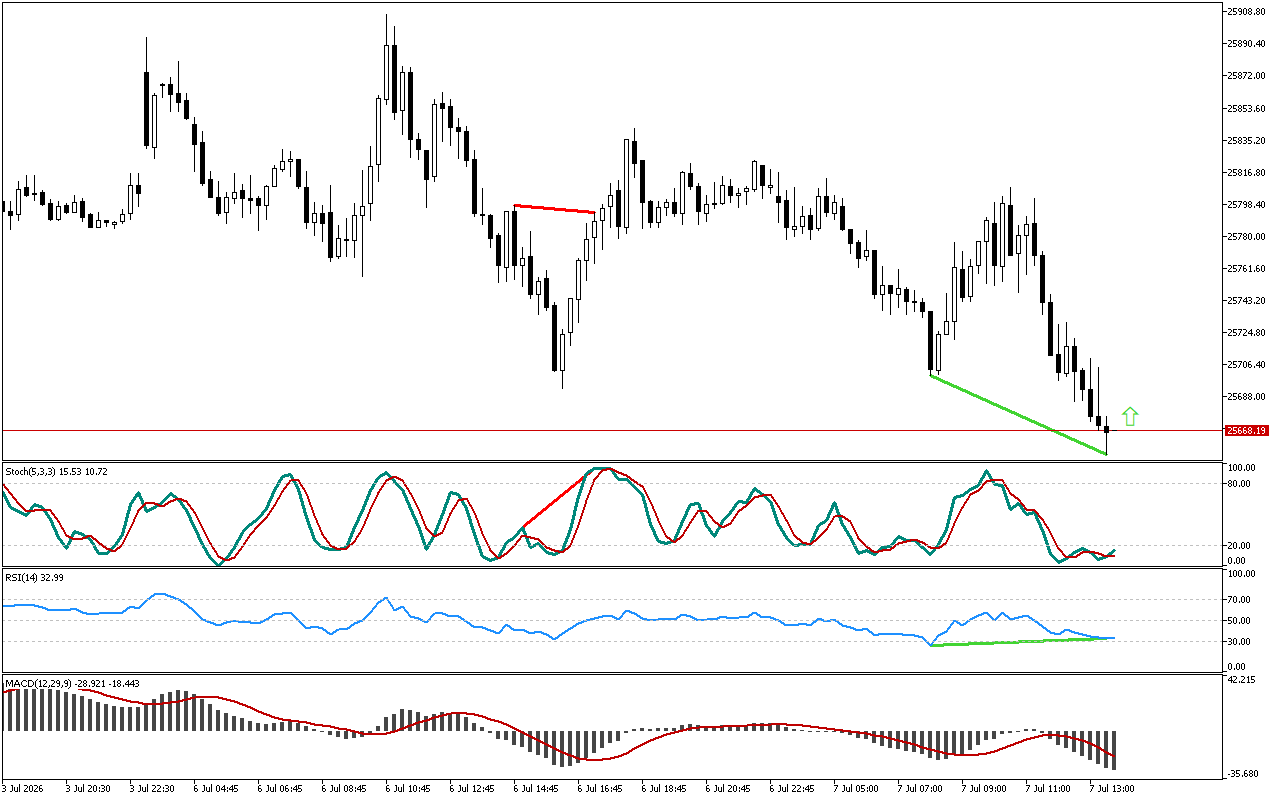
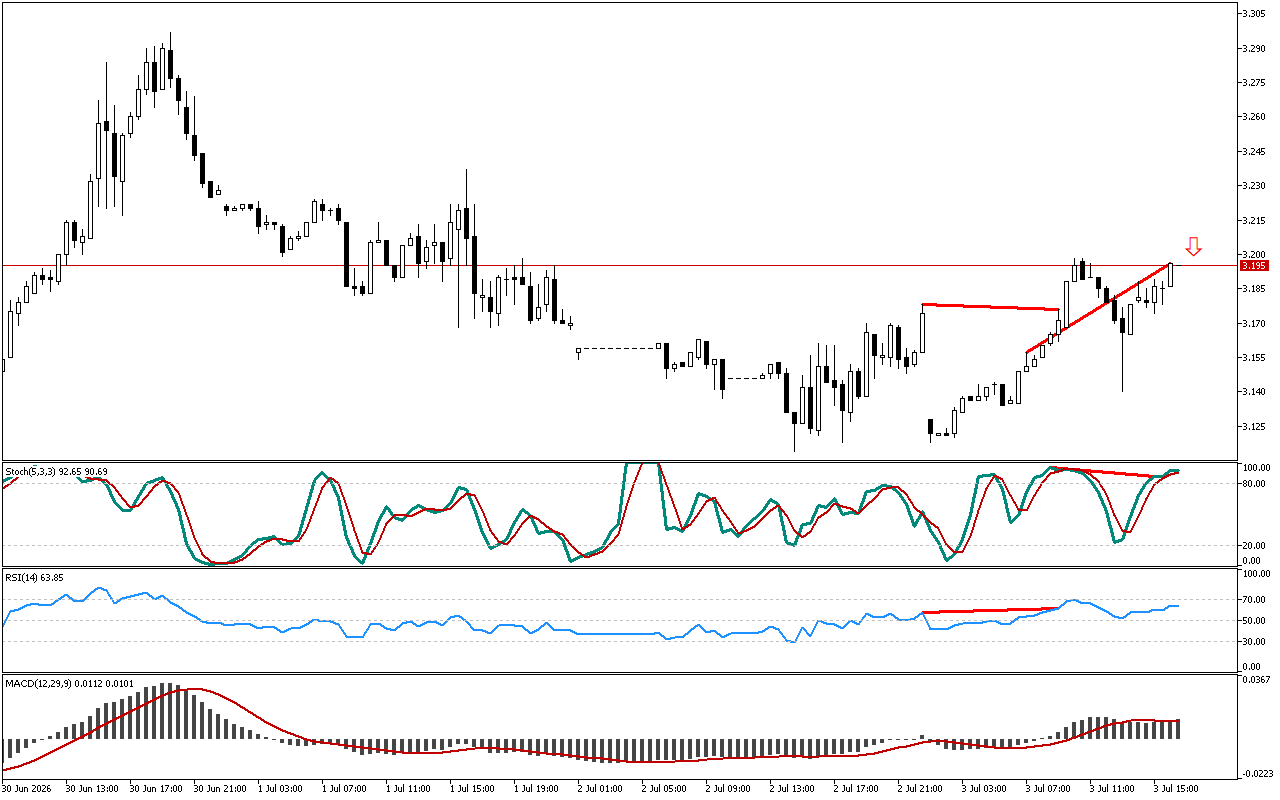
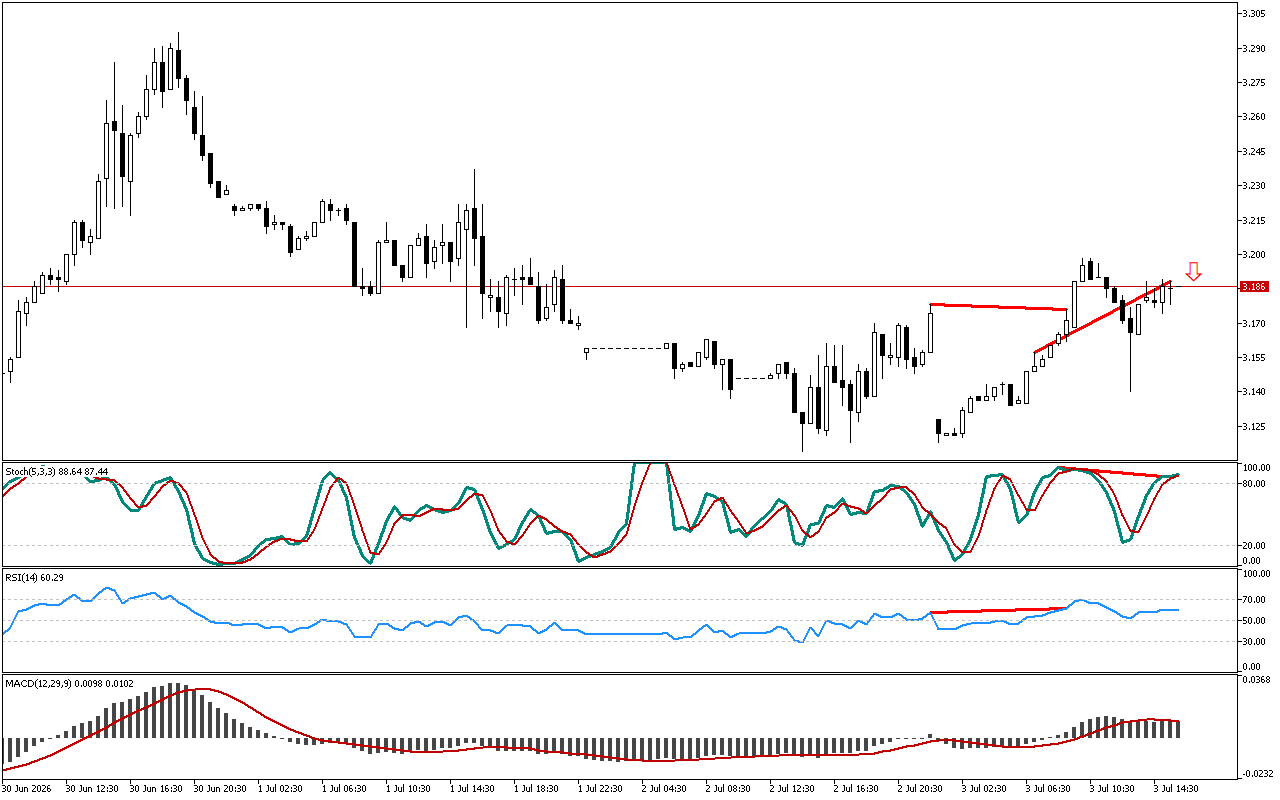
A divergence between the direction of price movement and Stochastic indicator has formed on the Natural Gas chart. Although the price is decreasing, Stochastic is directed upward, which is the first sign of easing pressure on the price.
The RSI indicator is now below the mark of 50. The position of the indicator below this level indicates the predominance of a downward trend.
The MACD histogram is below the signal line. This indicator shows medium- and long-term trends and may ignore short-term price reversals and pullbacks sometimes.
For Natural Gas now the most evident trading strategy is opening the long positions. A trader can enter the market at the current levels or when a preset level is being retested.
📌 Entry: 3.273
✔️ First target: 3.319
✔️ Second target: 3.357
❌ Stop order: 3.247
Natural Gas M30: Divergence signal is received from the Stochastic
Leave a Reply