

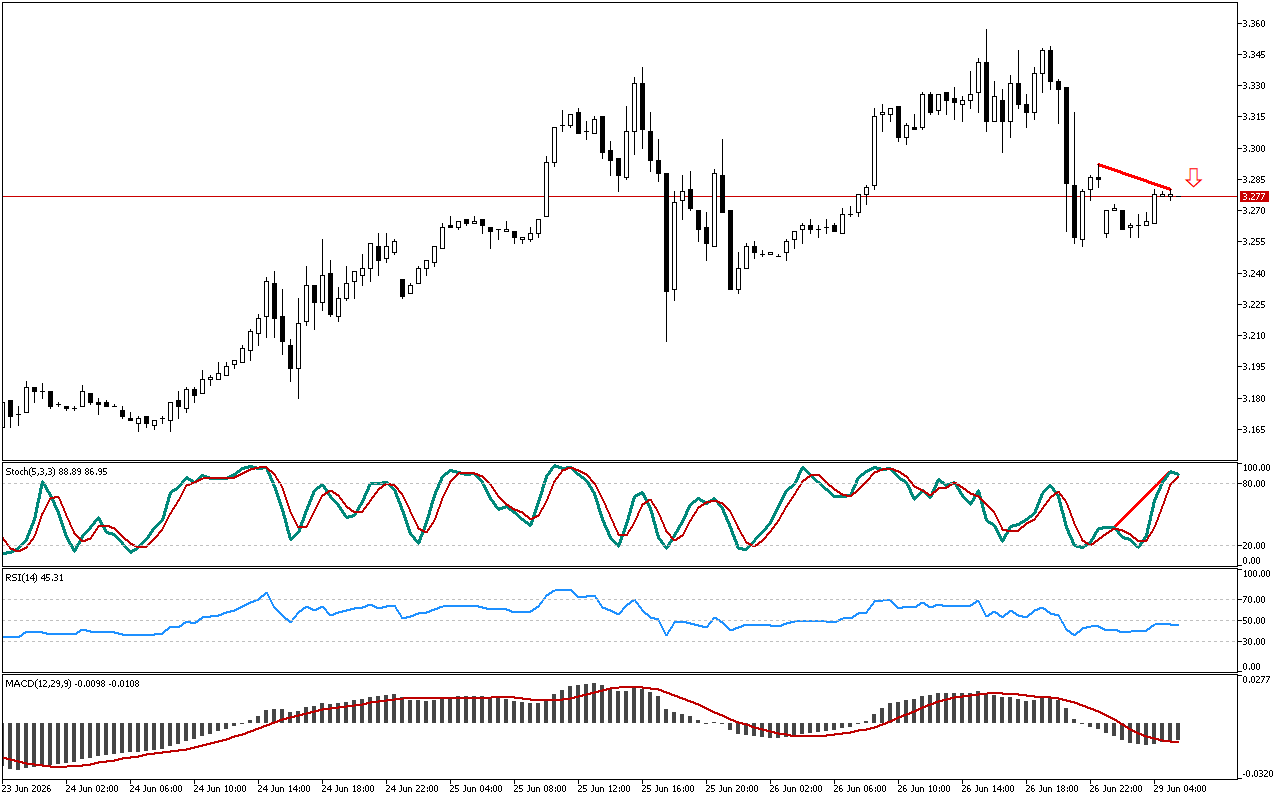
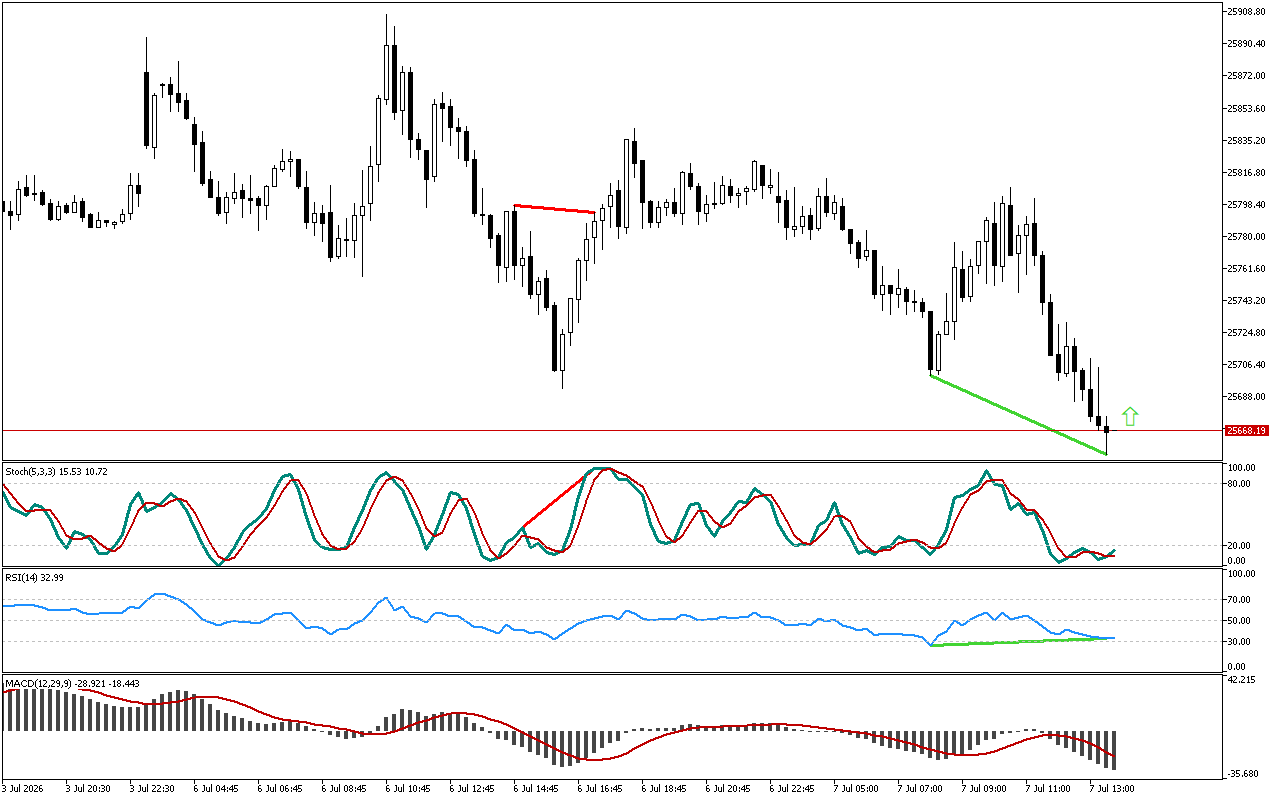
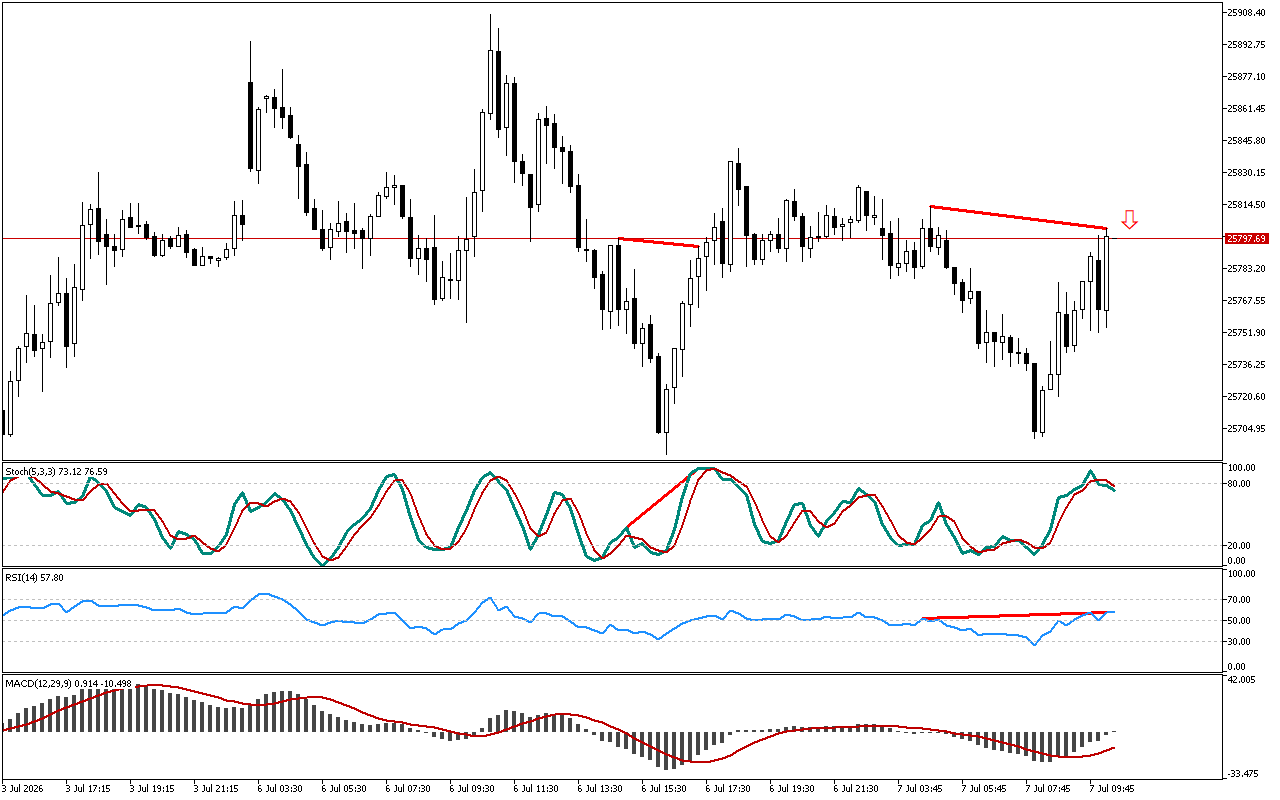
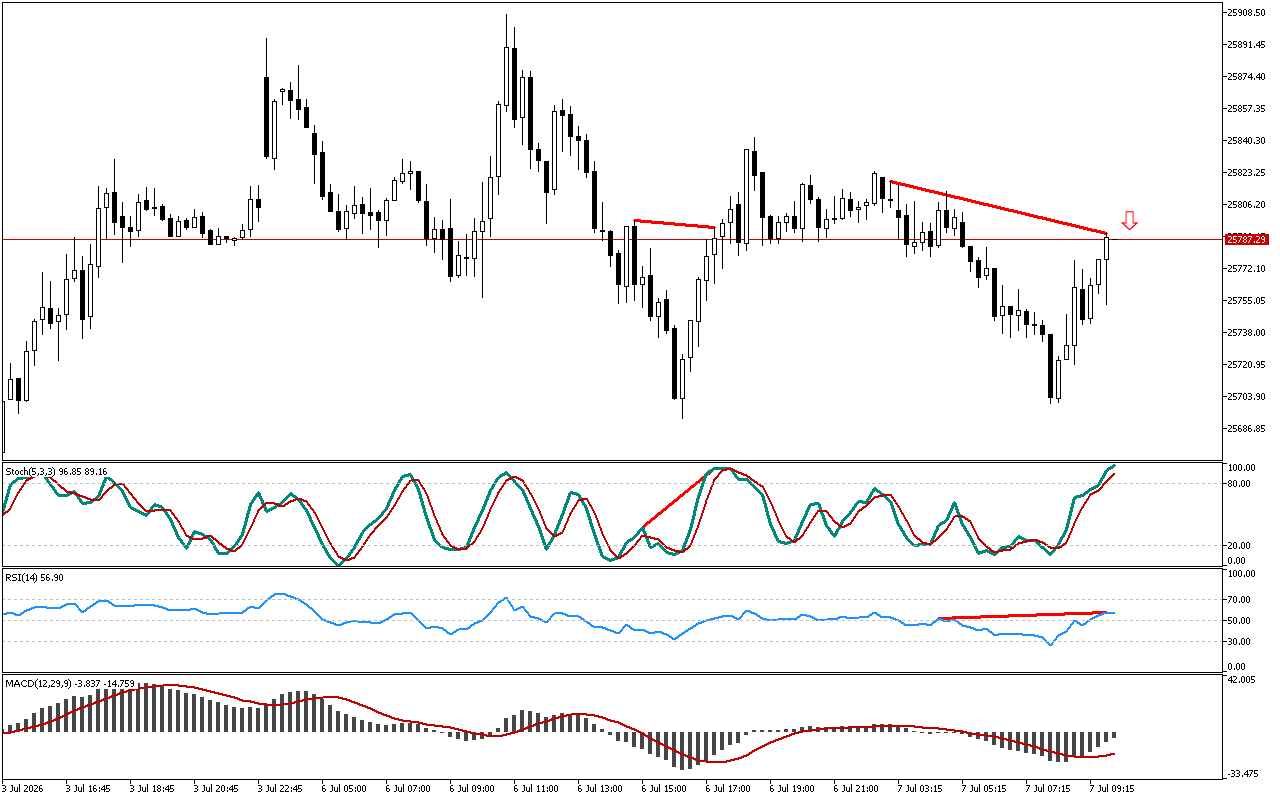
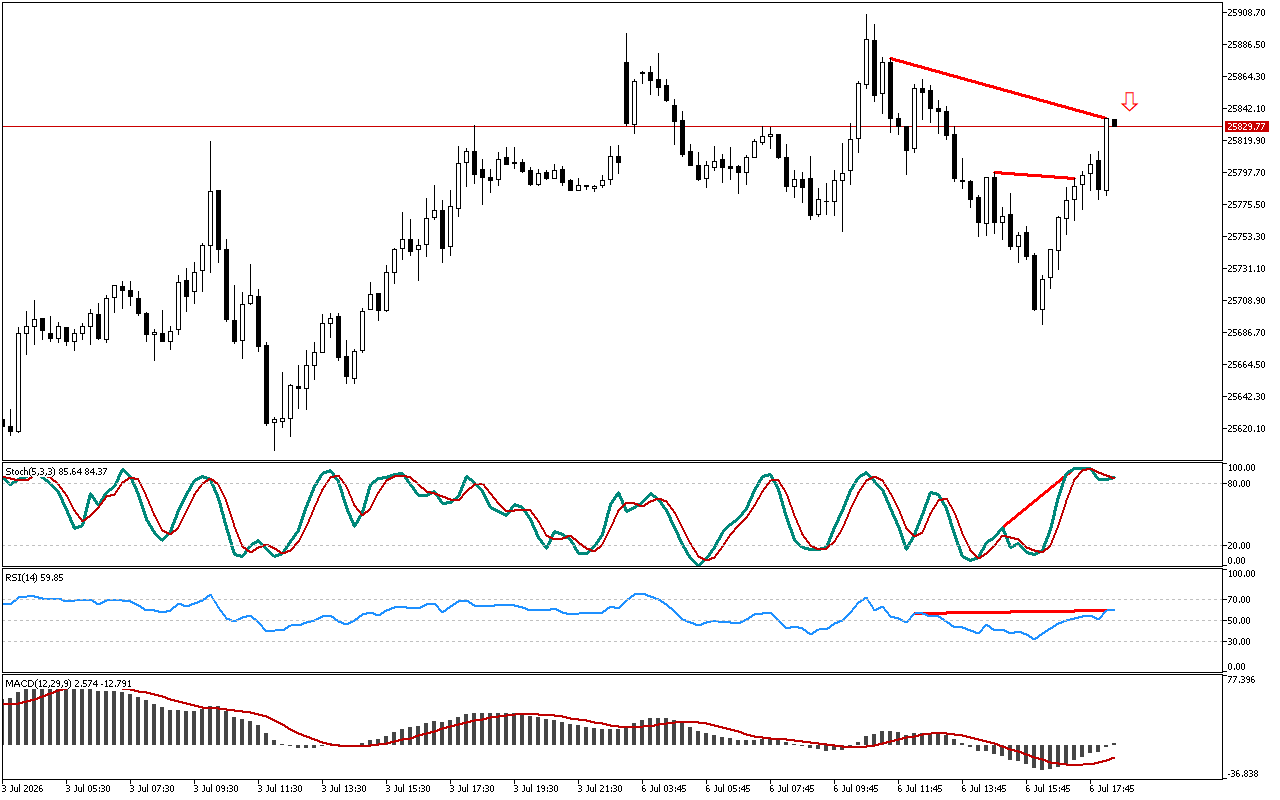
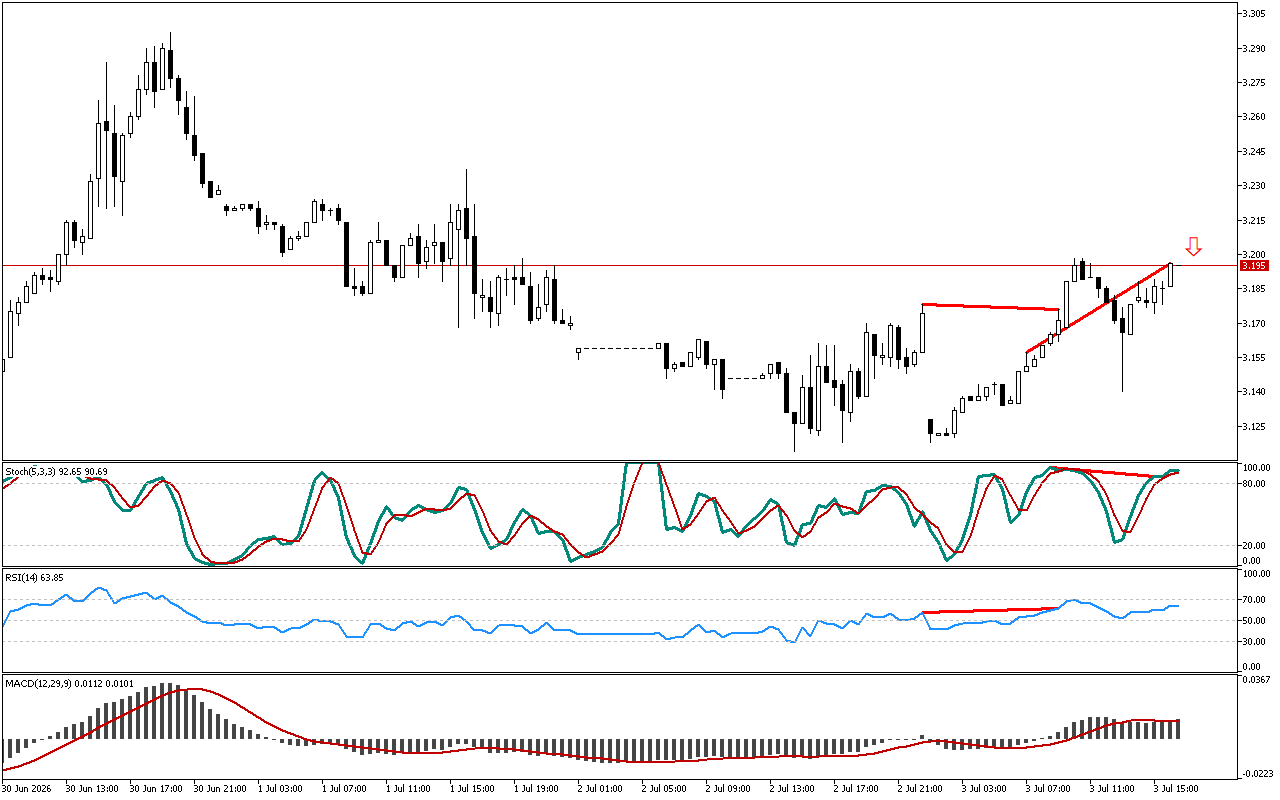
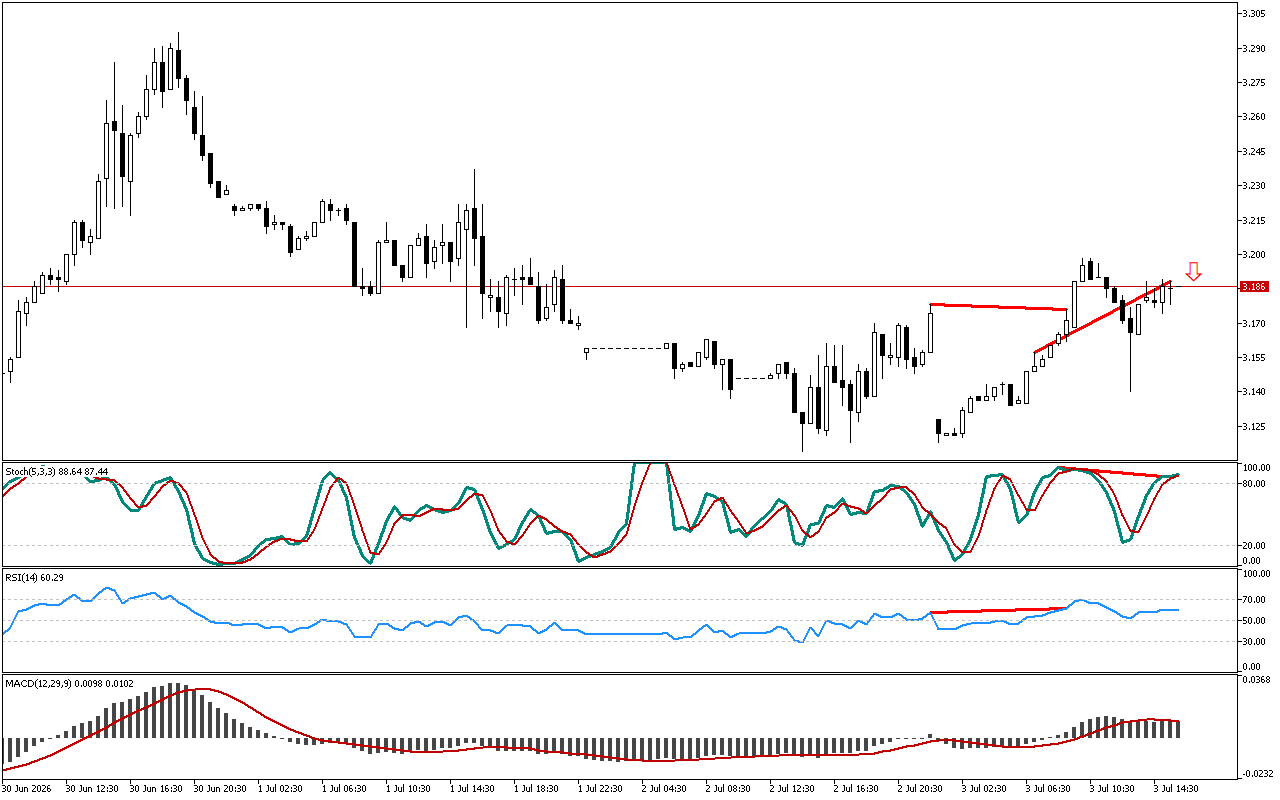
The price failed to form a new high, while the Stochastic indicator remains above the 20 level. This divergence, marked with a red line on the chart, indicates weakening of an upward momentum and increases the probability of a price decline.
The RSI indicator is now below the mark of 50. The position of the indicator below this level indicates the predominance of a downward trend.
The histogram of the MACD indicator remains above the signal line, indicating the local development of an upward movement. However, the indicator indications do not contradict the signal, marked on the chart.
Short positions should be prioritized to trade Natural Gas. A trader can enter using the current price levels or, alternatively, it can be done after a retest of the resistance level.
📌 Entry: 3.277
✔️ First target: 3.257
✔️ Second target: 3.226
❌ Stop order: 3.295
Natural Gas M30: A reversal signal from the Stochastic indicator
Leave a Reply