

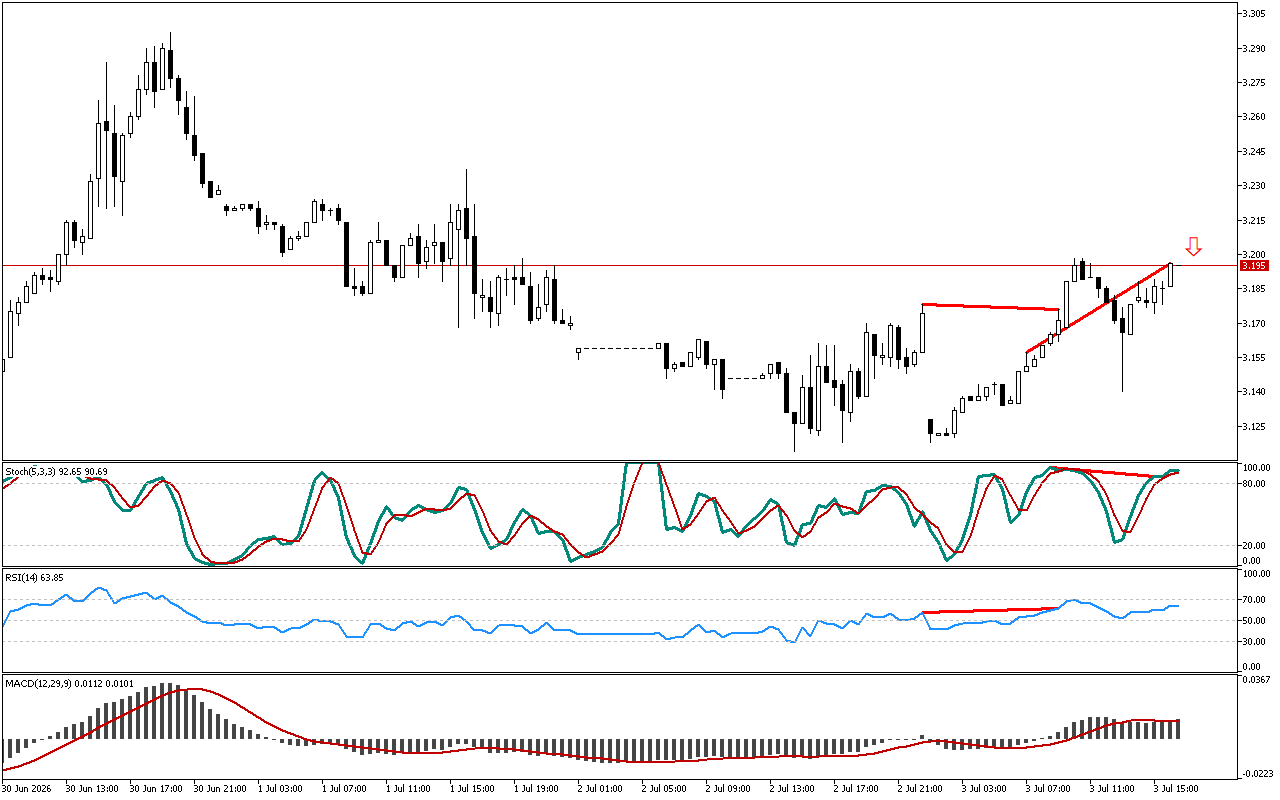
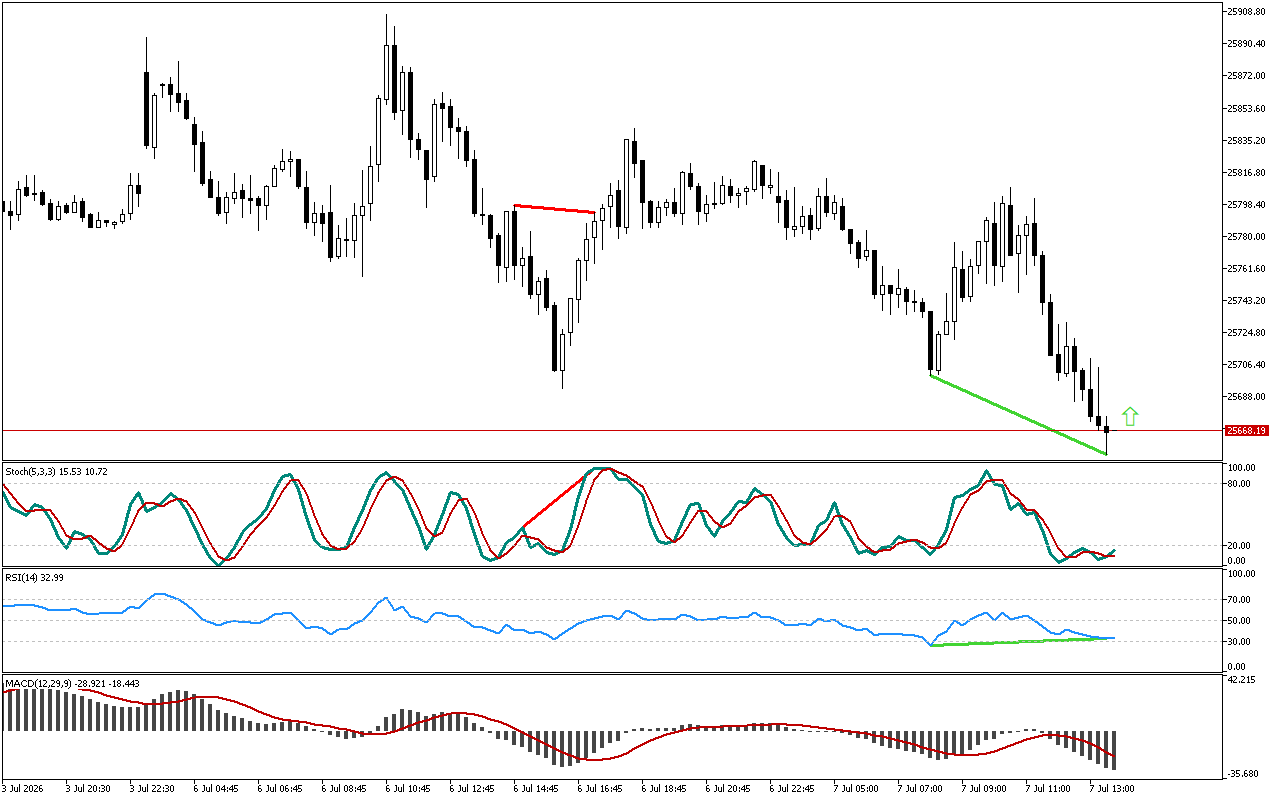
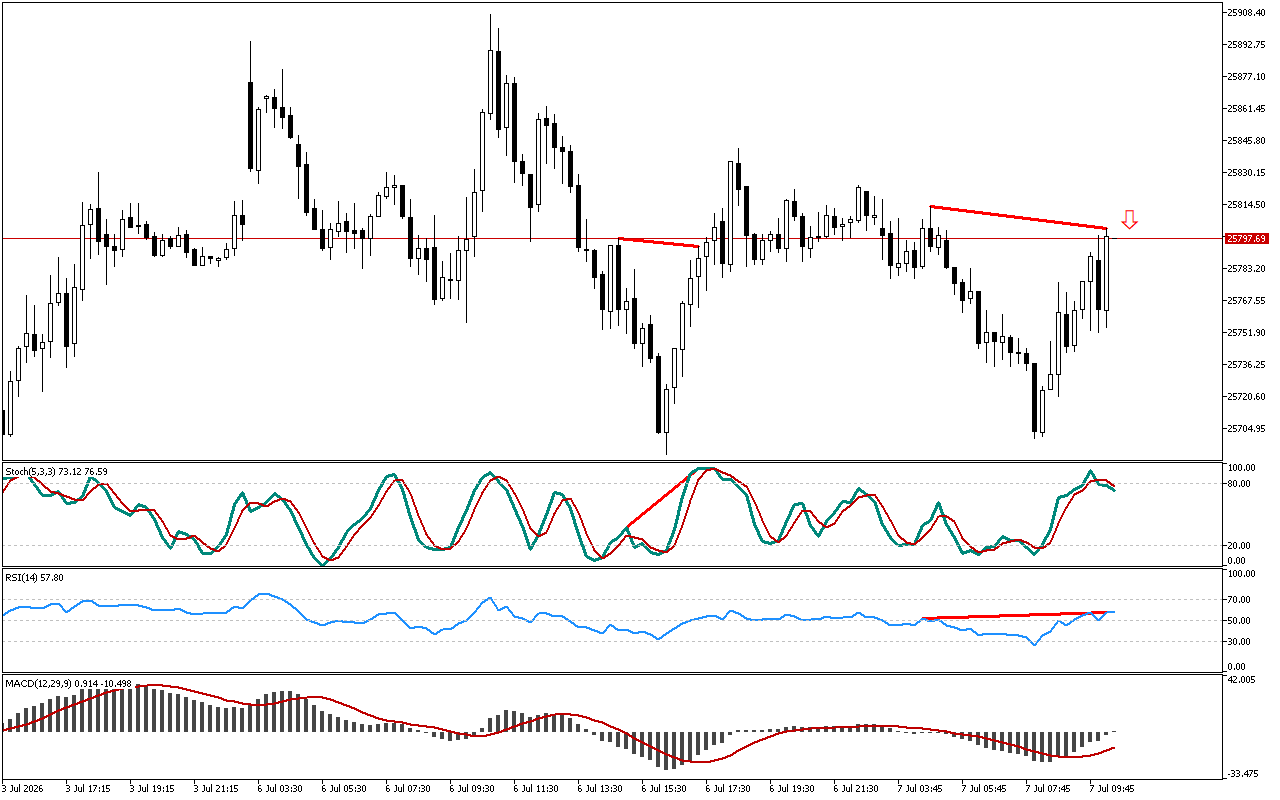
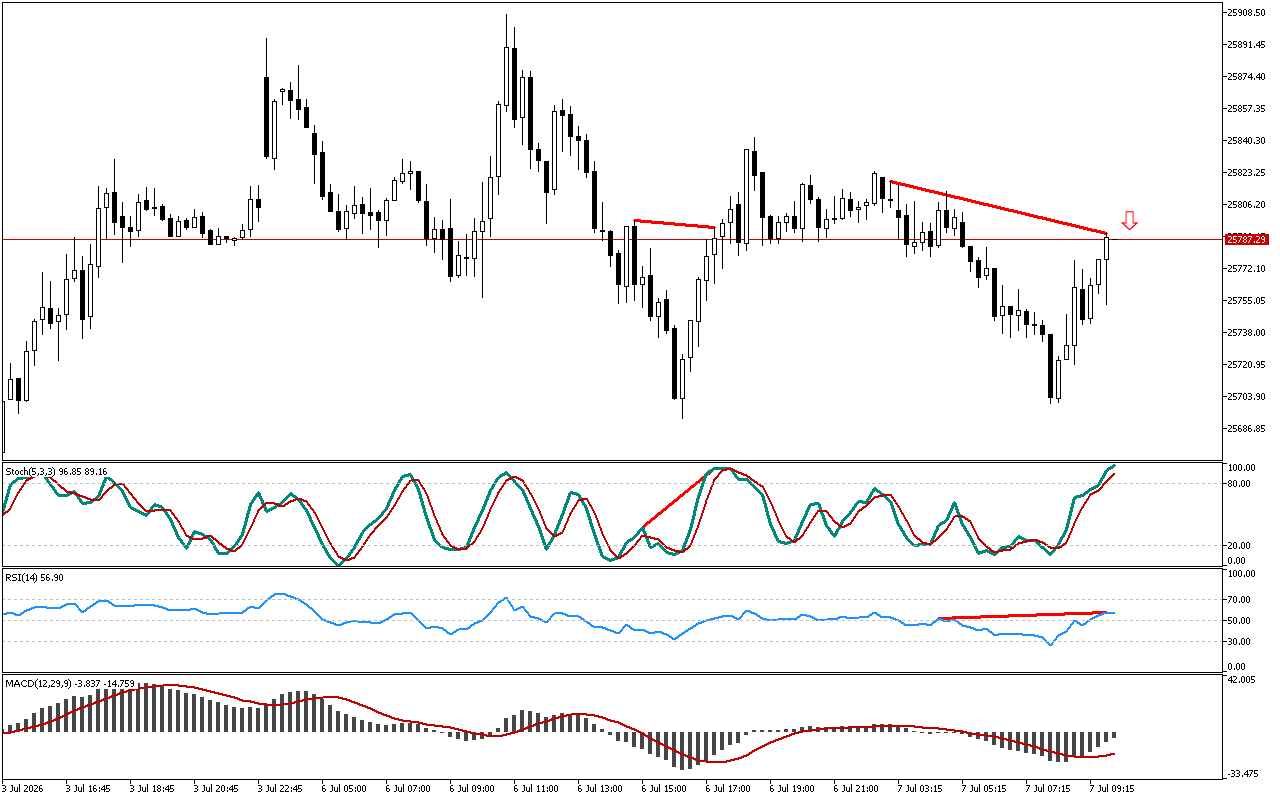
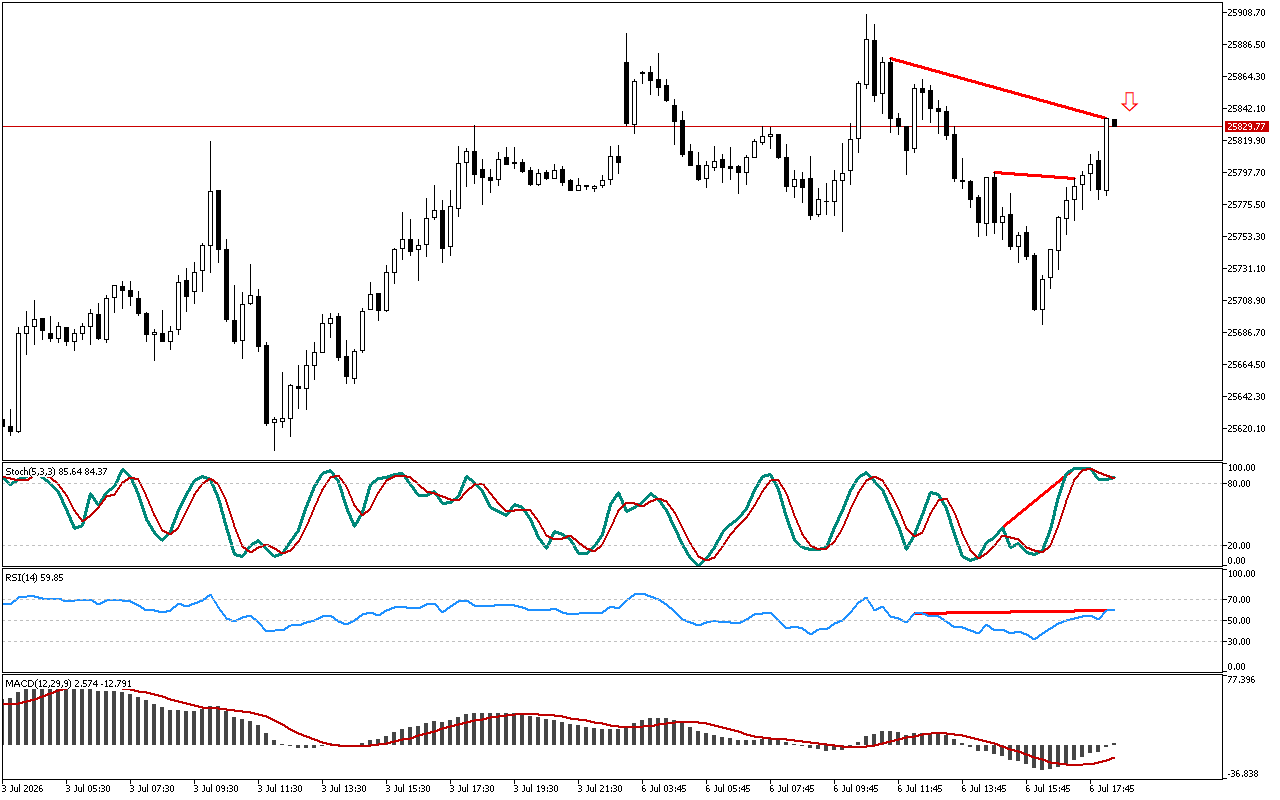
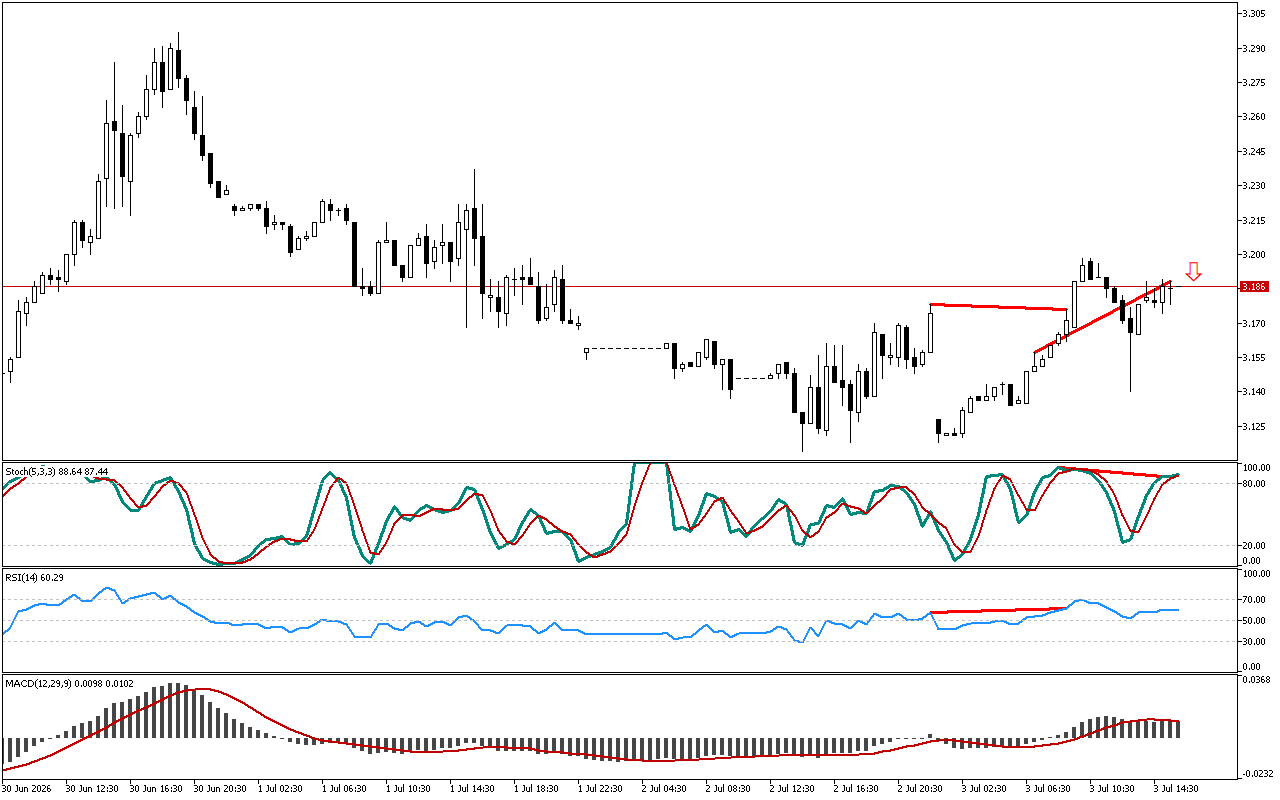
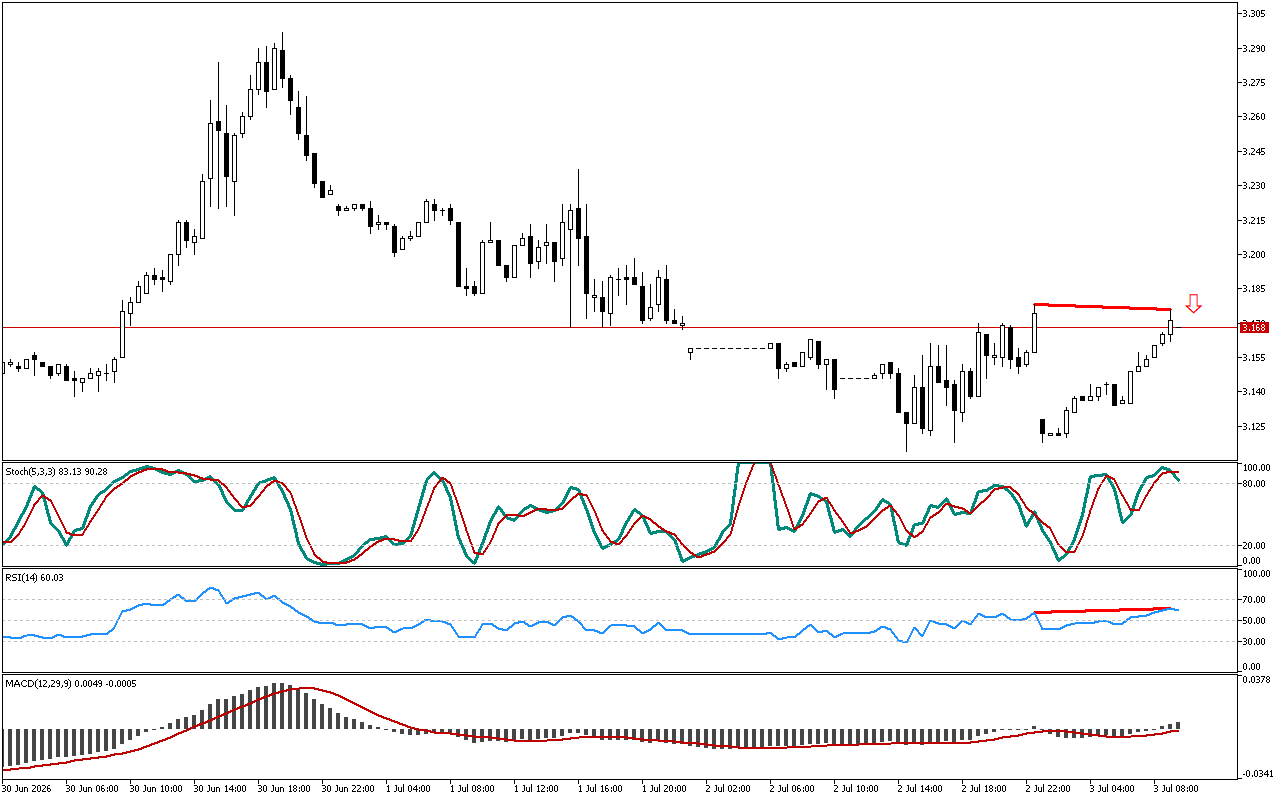
Let’s examine the Stochastic indicator. The oscillator shows the decay of the upward impulse along Natural Gas. The price chart has updated the local maximum, but the Stochastic is declining. This divergence is marked with a red line.
The previously noted reversal signal is strengthened by the divergence, recorded on the RSI indicator. The appearance of divergences on various technical indicators increases the probability of a reversal scenario.
The histogram of the MACD indicator remains above the signal line, indicating the local development of an upward movement. However, the indicator indications do not contradict the signal, marked on the chart.
It is recommended to focus on short positions on Natural Gas. Entry points can be detected now or upon the technical confirmation after a retest of this level.
📌 Entry: 3.195
✔️ First target: 3.140
✔️ Second target: 3.109
❌ Stop order: 3.225
Natural Gas M30: There is also a downward divergence at the Stochastic after the RSI
Leave a Reply