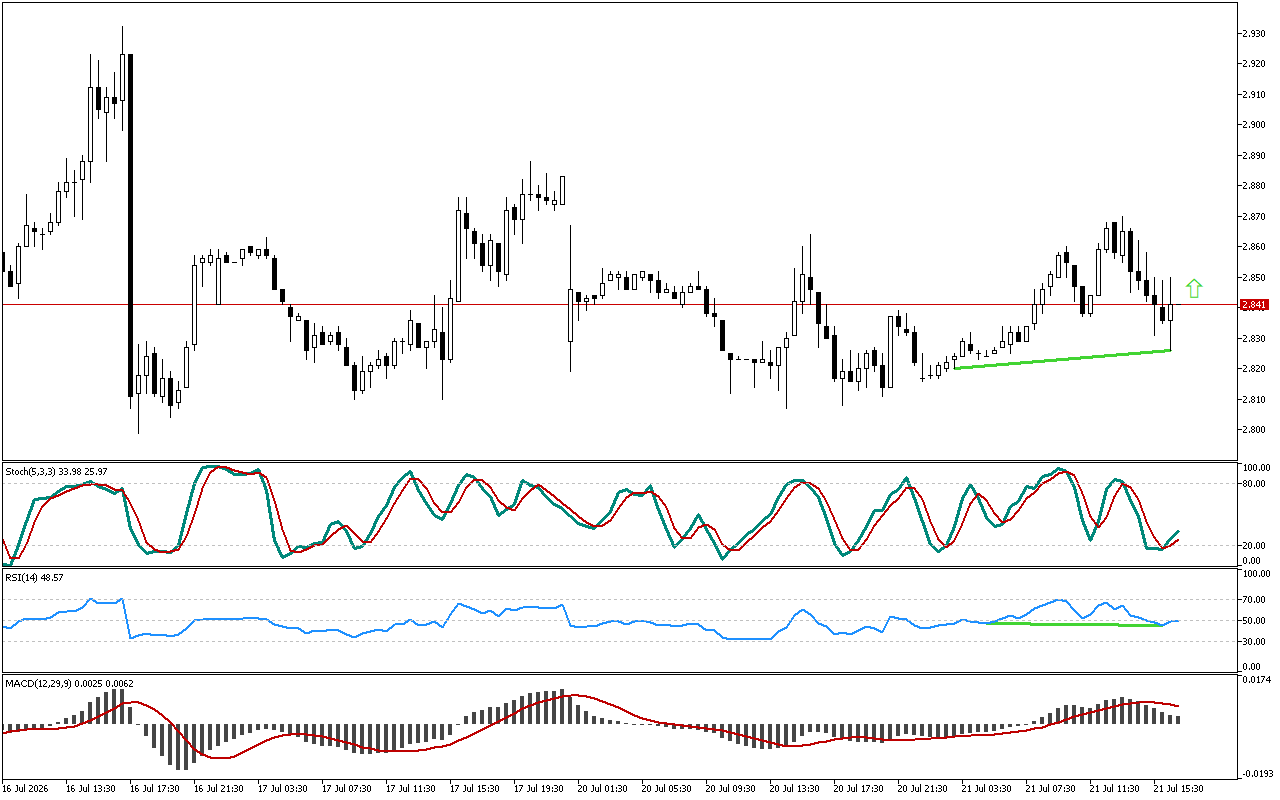
A classic divergence marked with a green line has been formed between the price chart and the RSI indicator. The…
Read More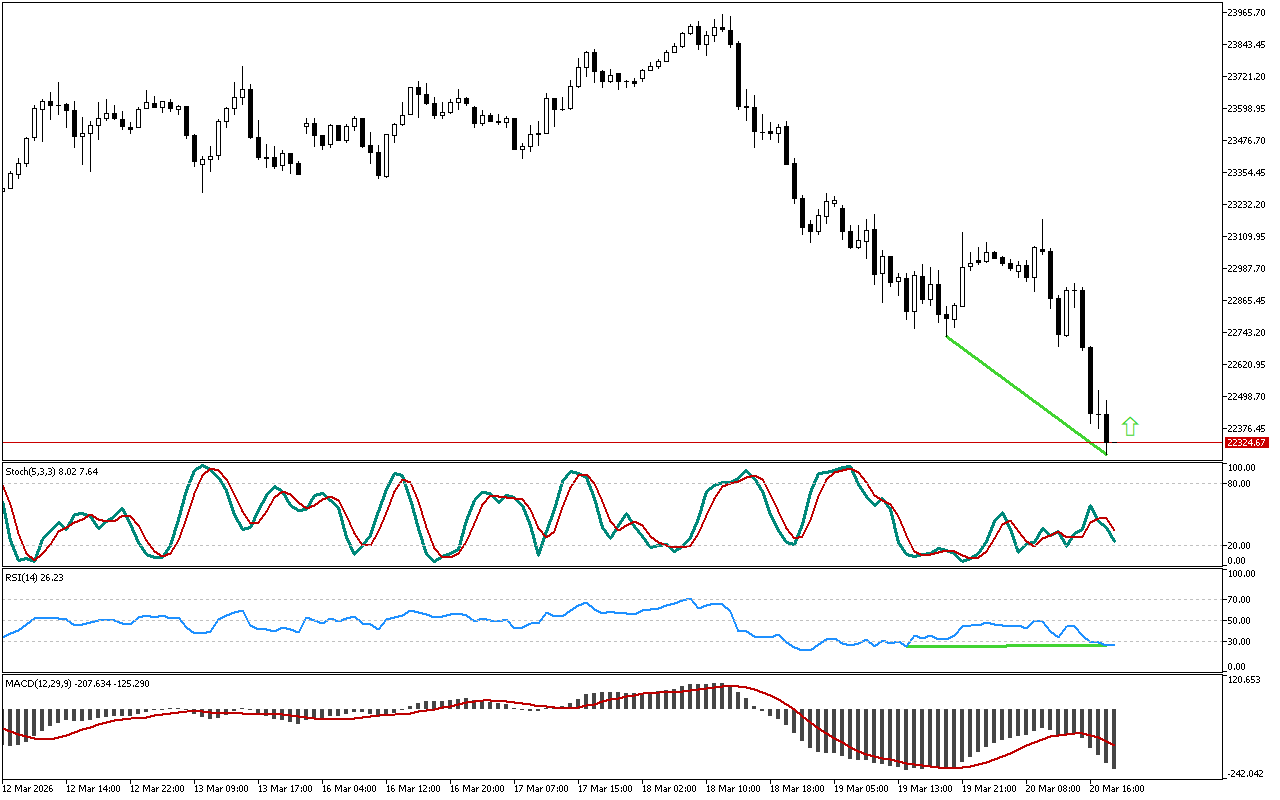

A classic divergence marked with a green line has been formed between the price chart and the RSI indicator. The…
Read More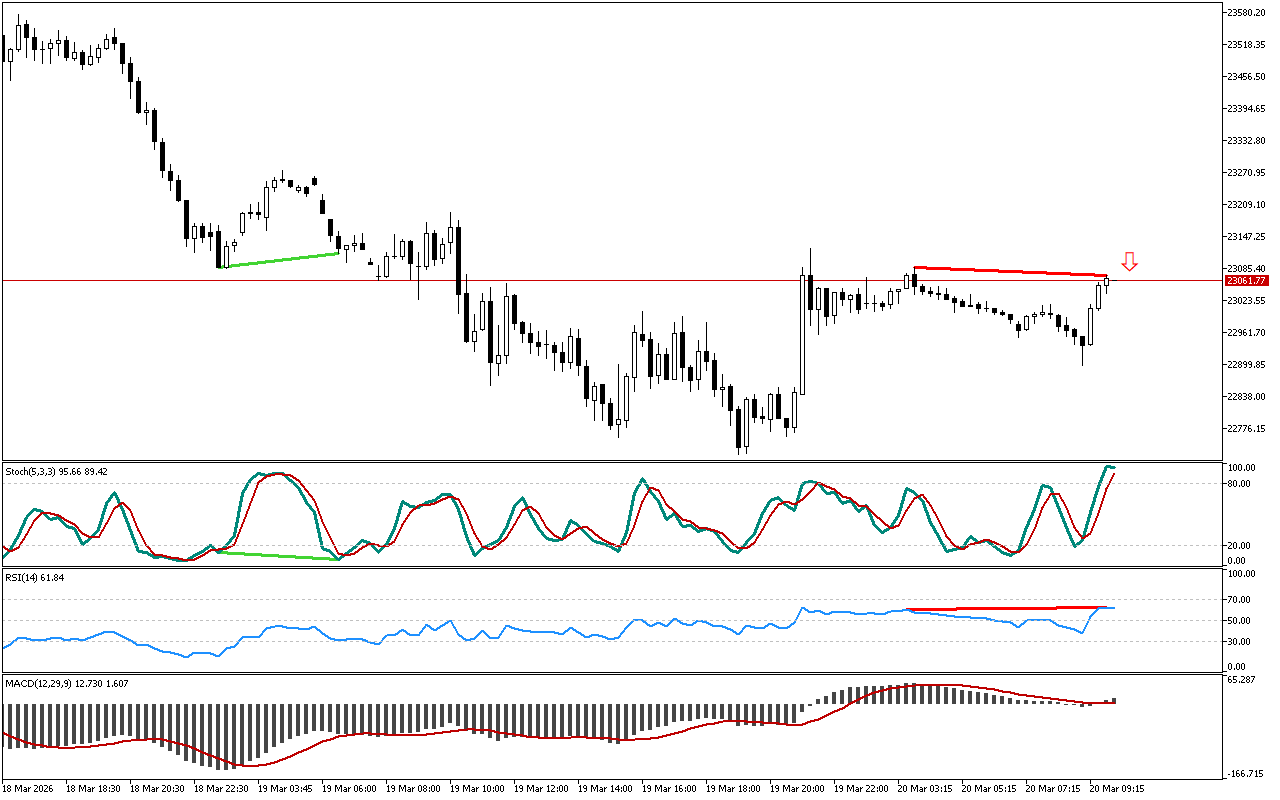
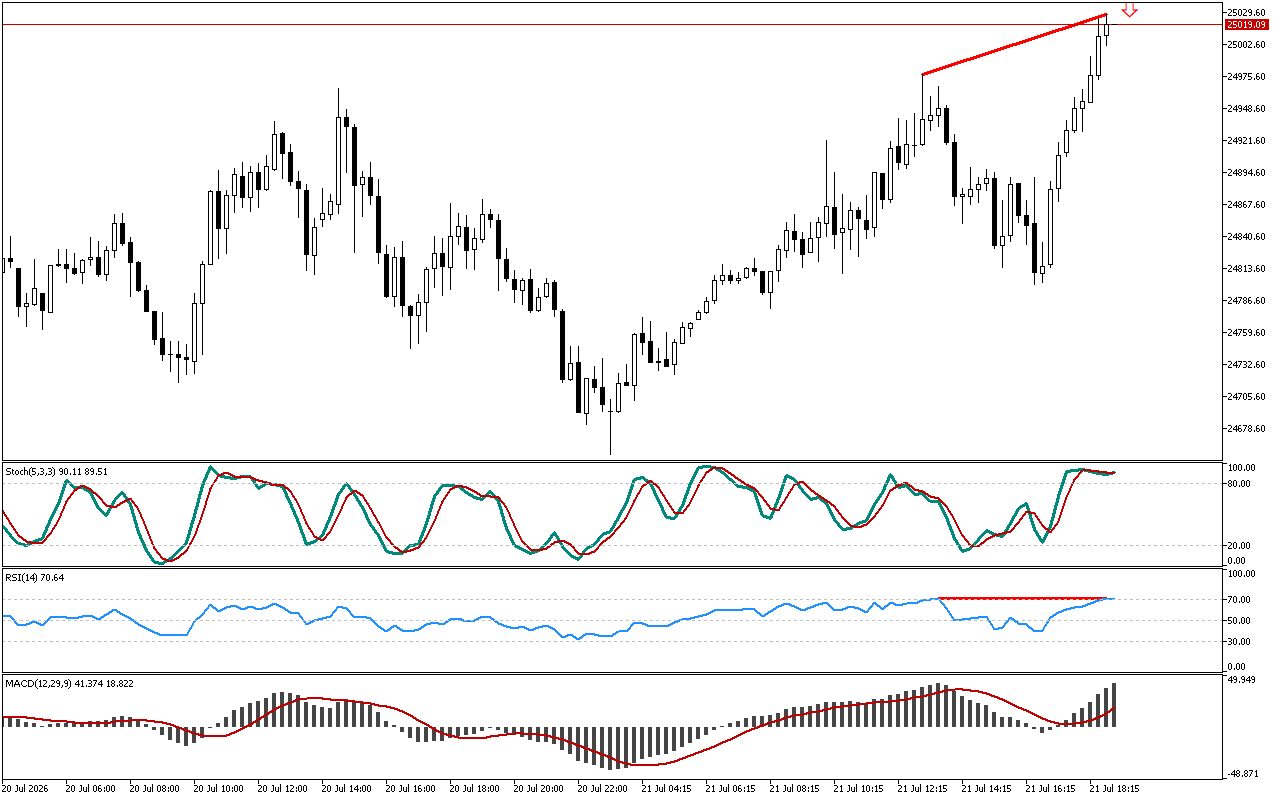
The RSI oscillator detects a discrepancy. The price failed to reach a new peak, while the RSI indicator rose above…
Read More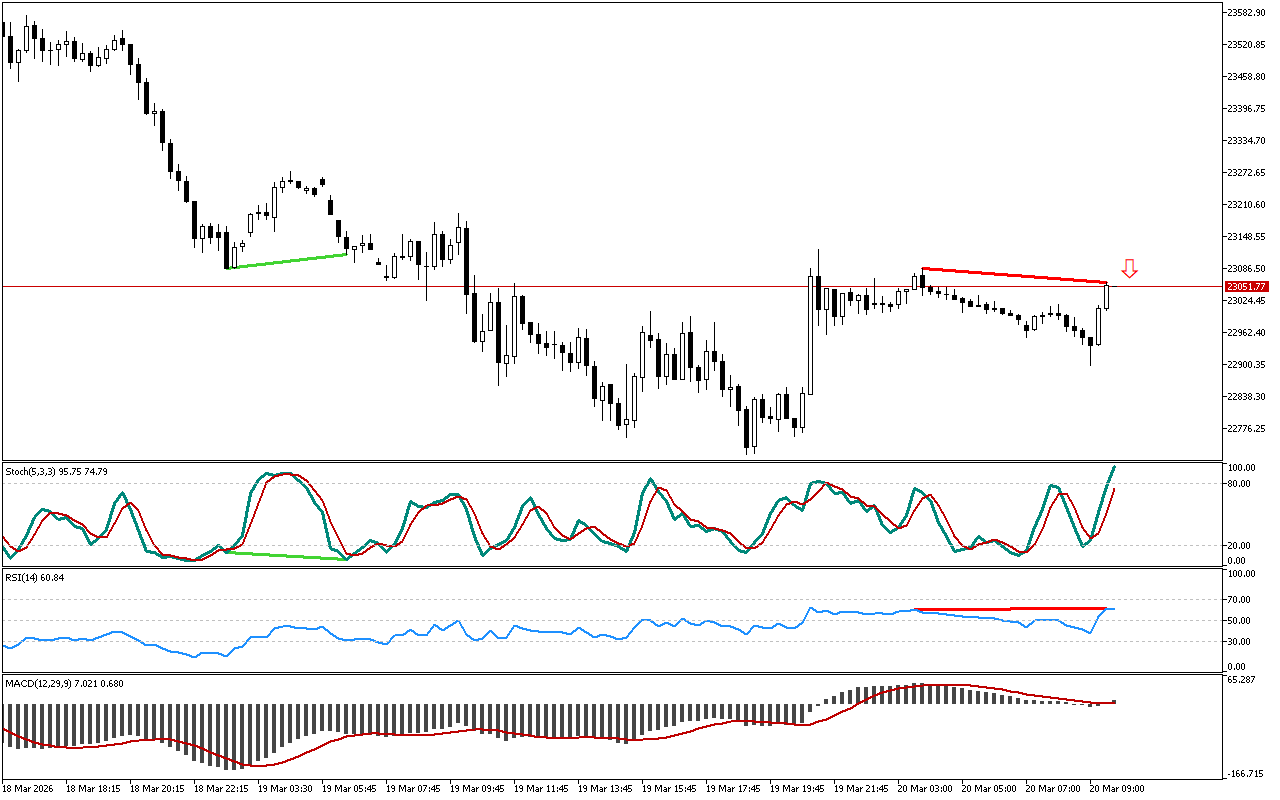
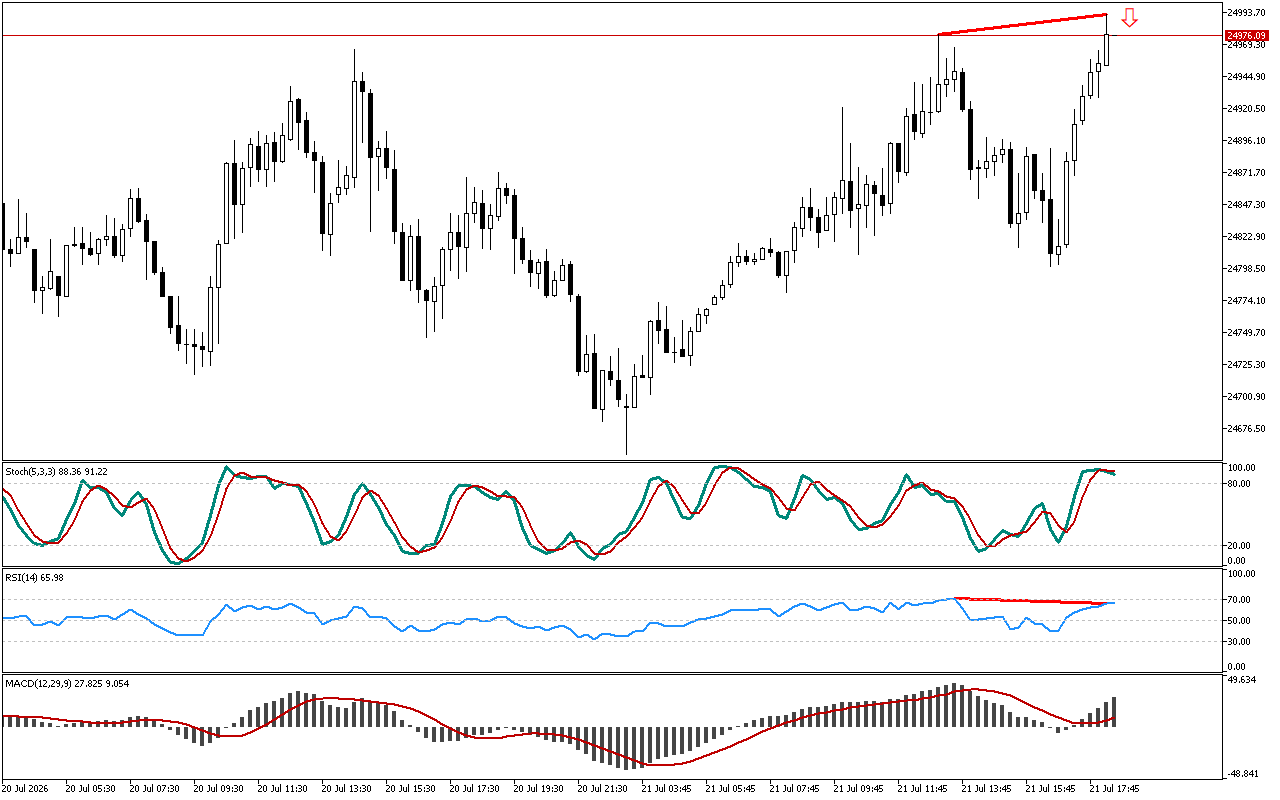
The RSI oscillator detects a discrepancy. The price failed to reach a new peak, while the RSI indicator rose above…
Read More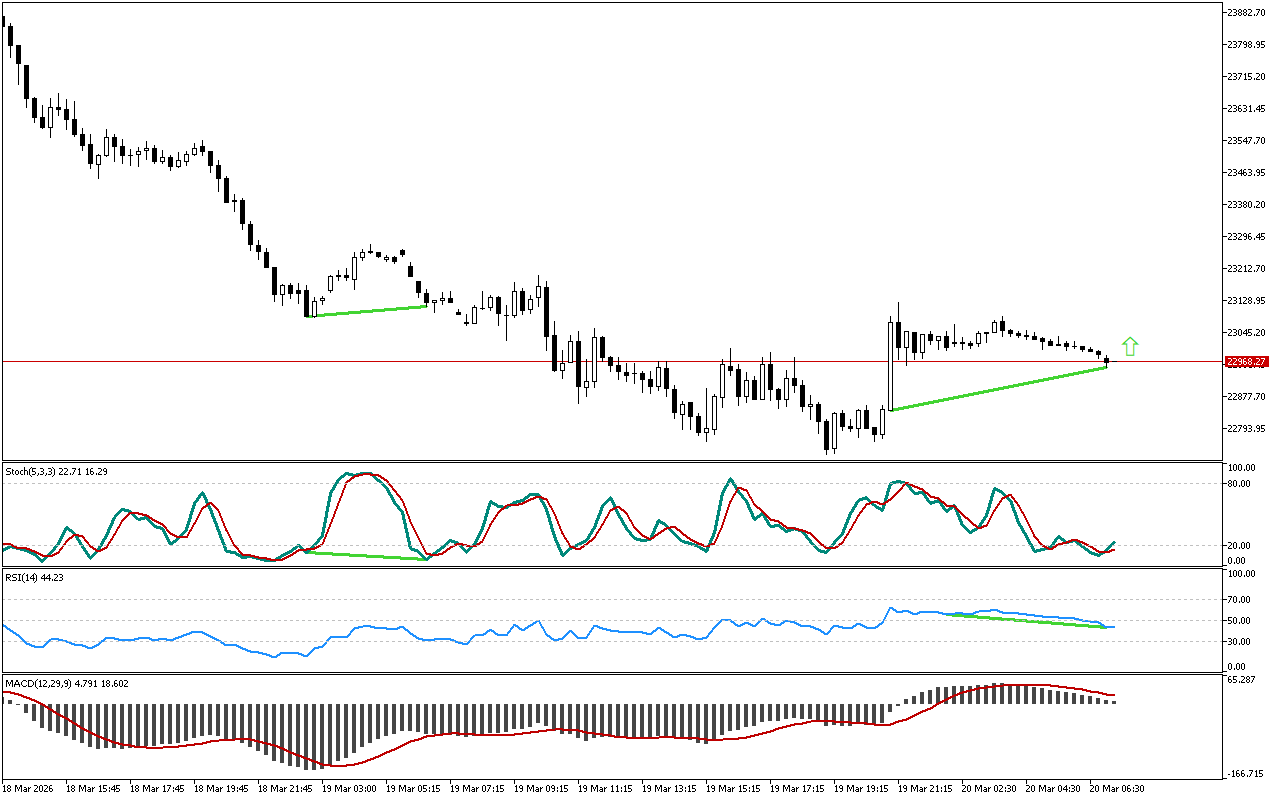
The price failed to reach a new low, while the RSI indicator shows an upward trend. The formed reverse divergence…
Read More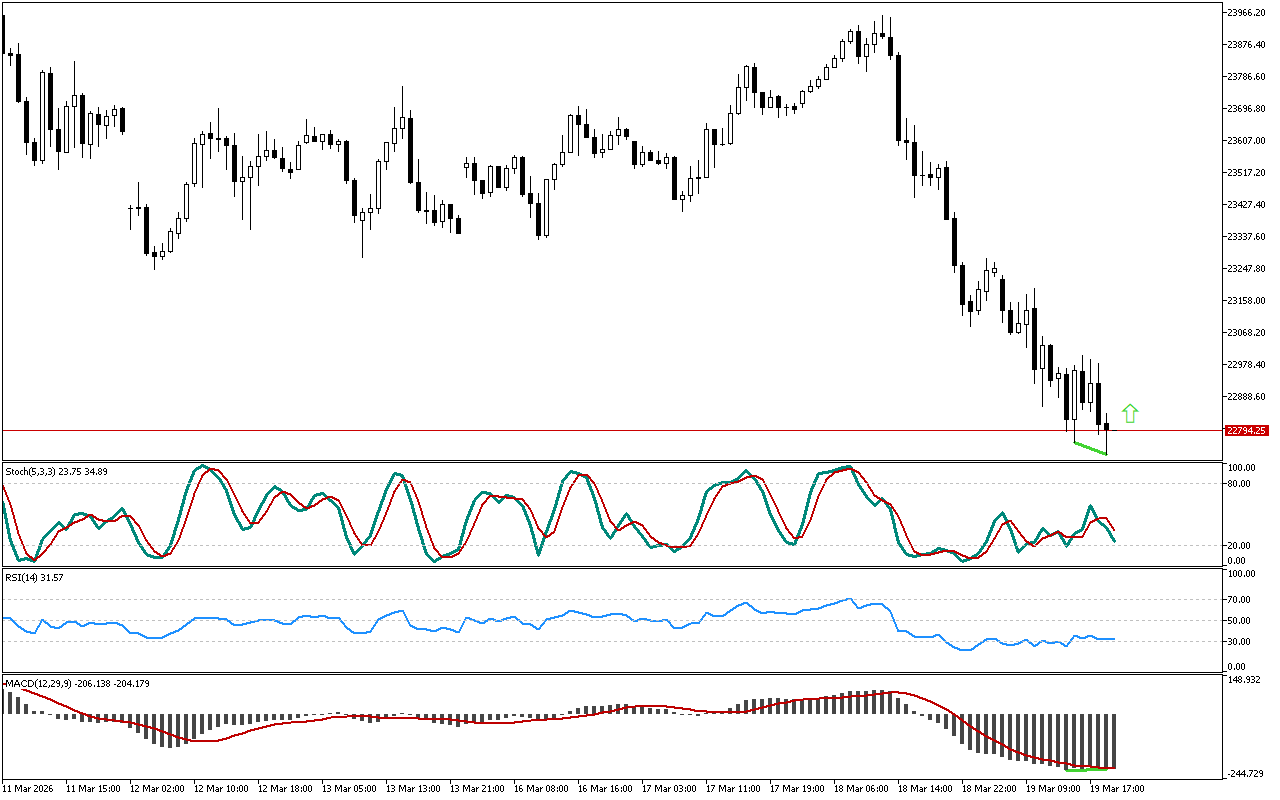
Let’s review the indications of the MACD. Despite the fact that DAX 40 maintains a downward trend, the MACD indicator…
Read More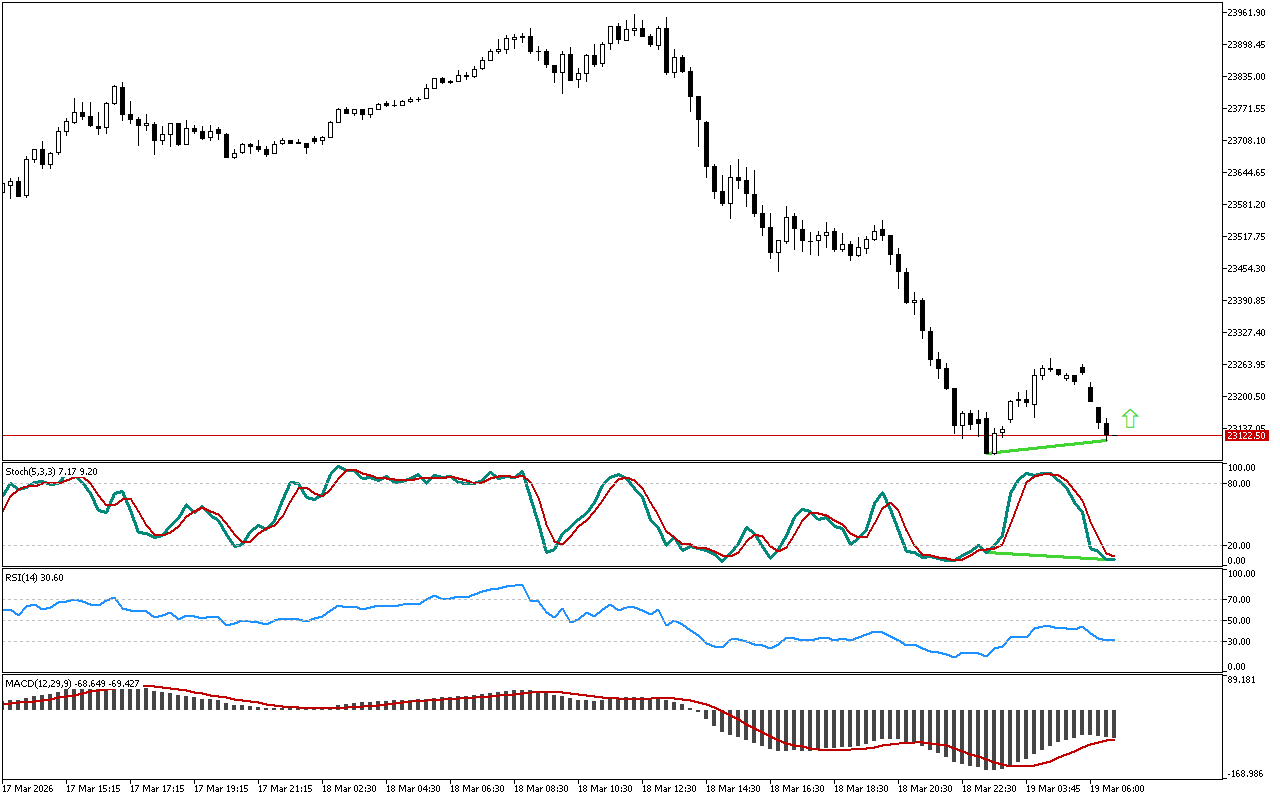
The DAX 40 maintains an upward direction of movement, while Stochastic has fallen below 20. The formed reverse divergence is…
Read More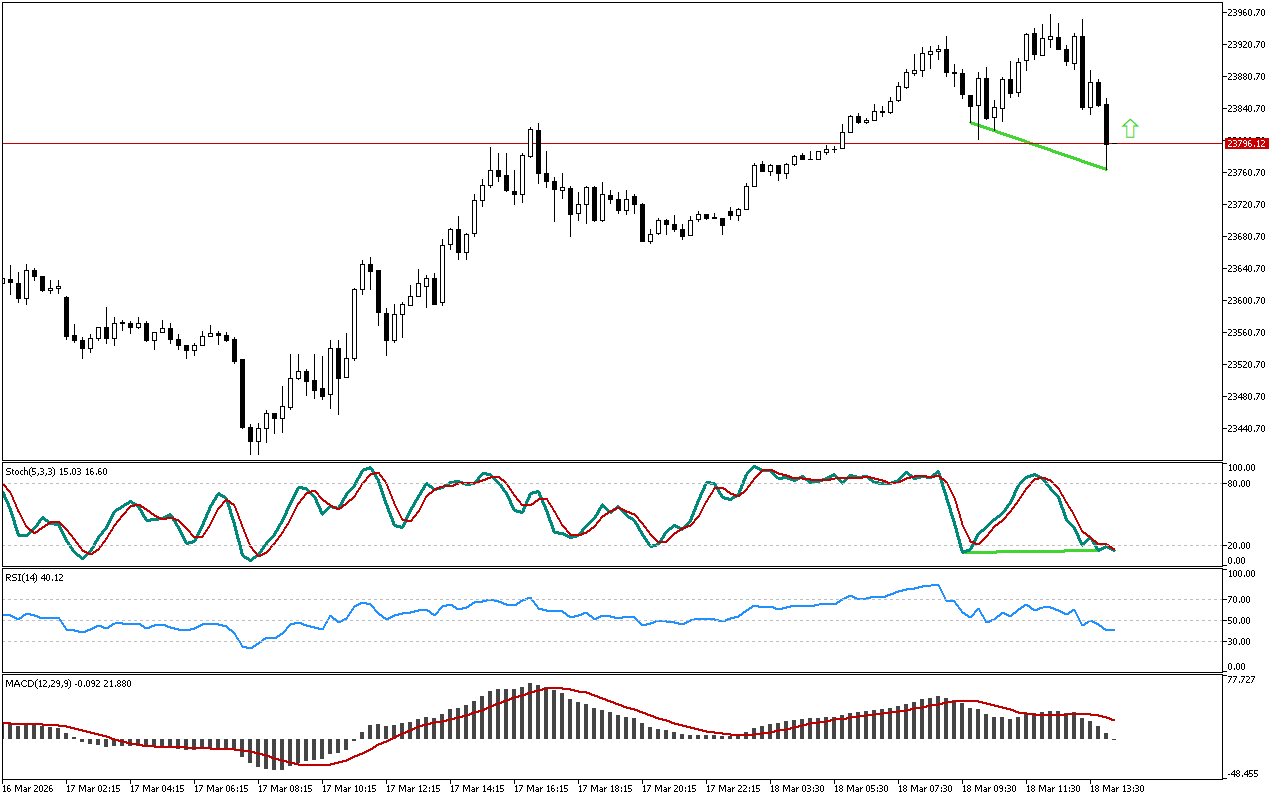
A divergence between the direction of price movement and Stochastic indicator has formed on the DAX 40 chart. Although the…
Read More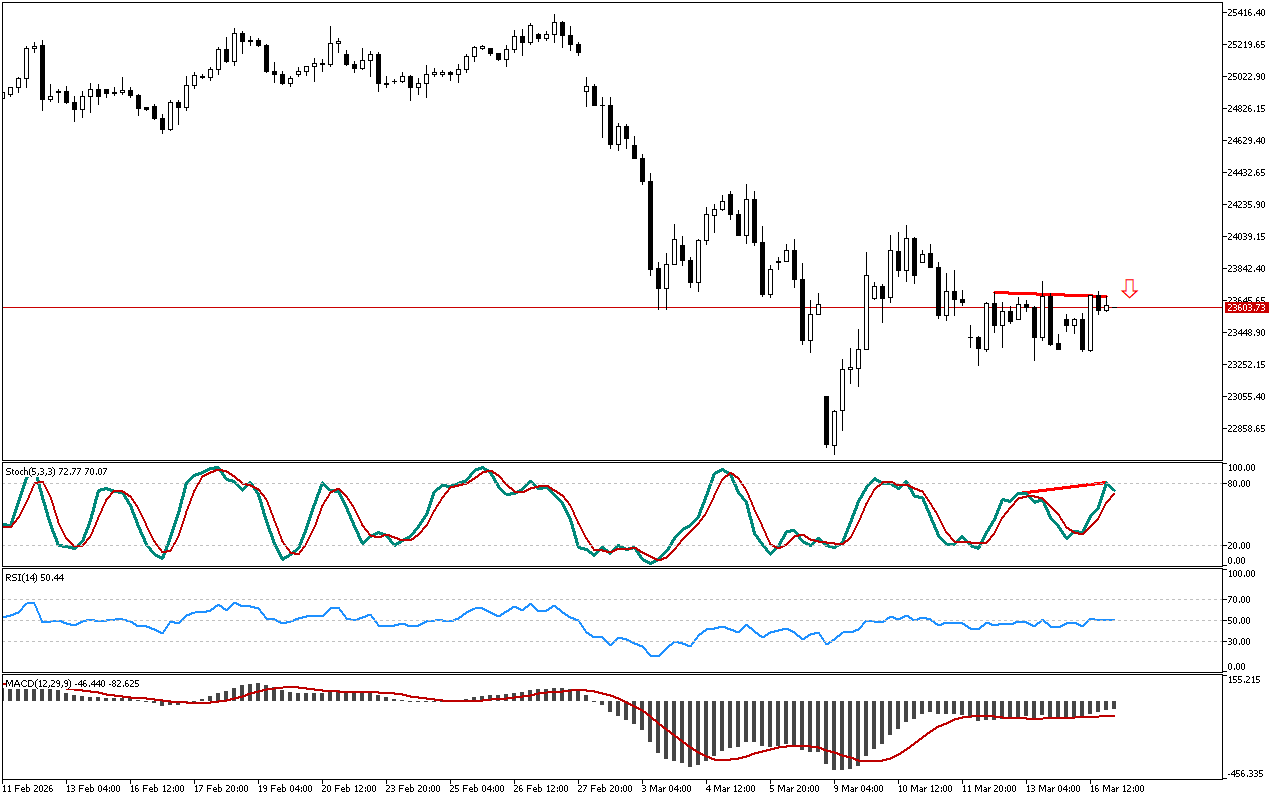
The price failed to form a new high, while the Stochastic indicator remains above the 20 level. This divergence, marked…
Read More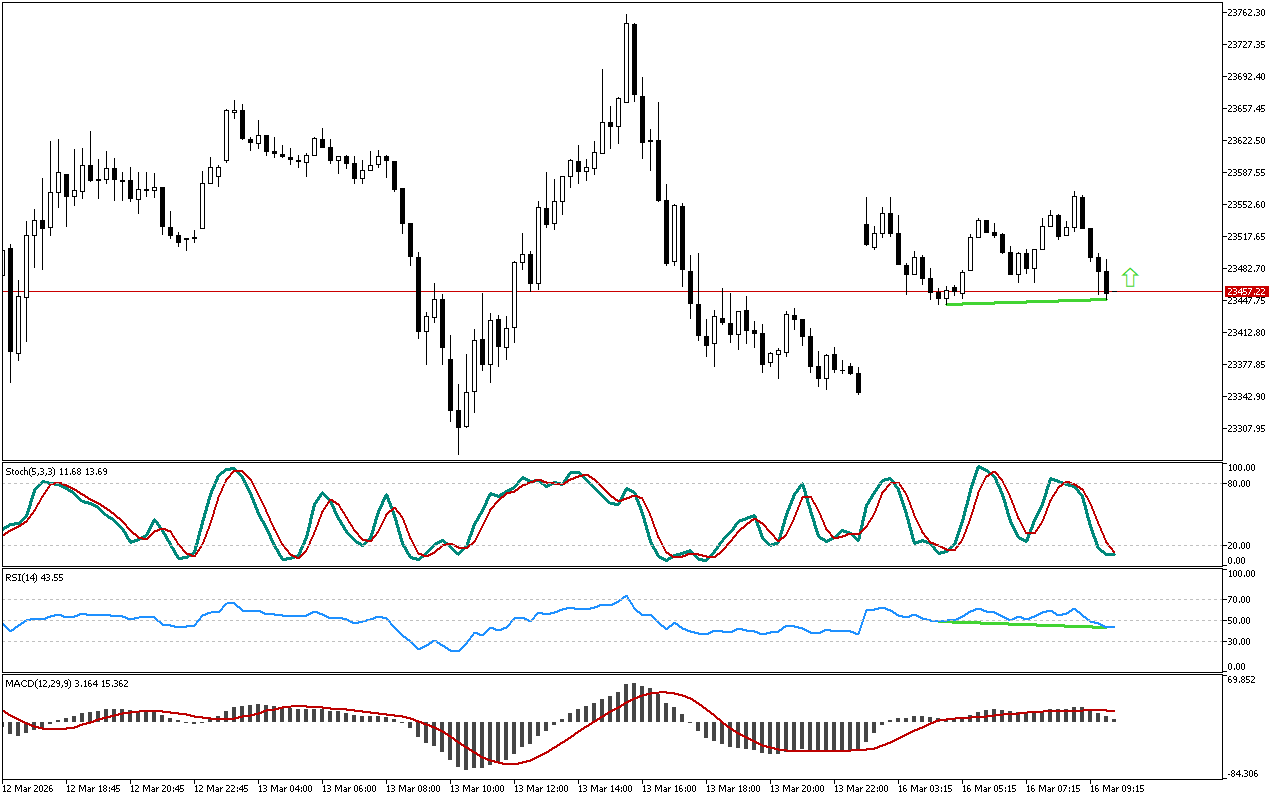
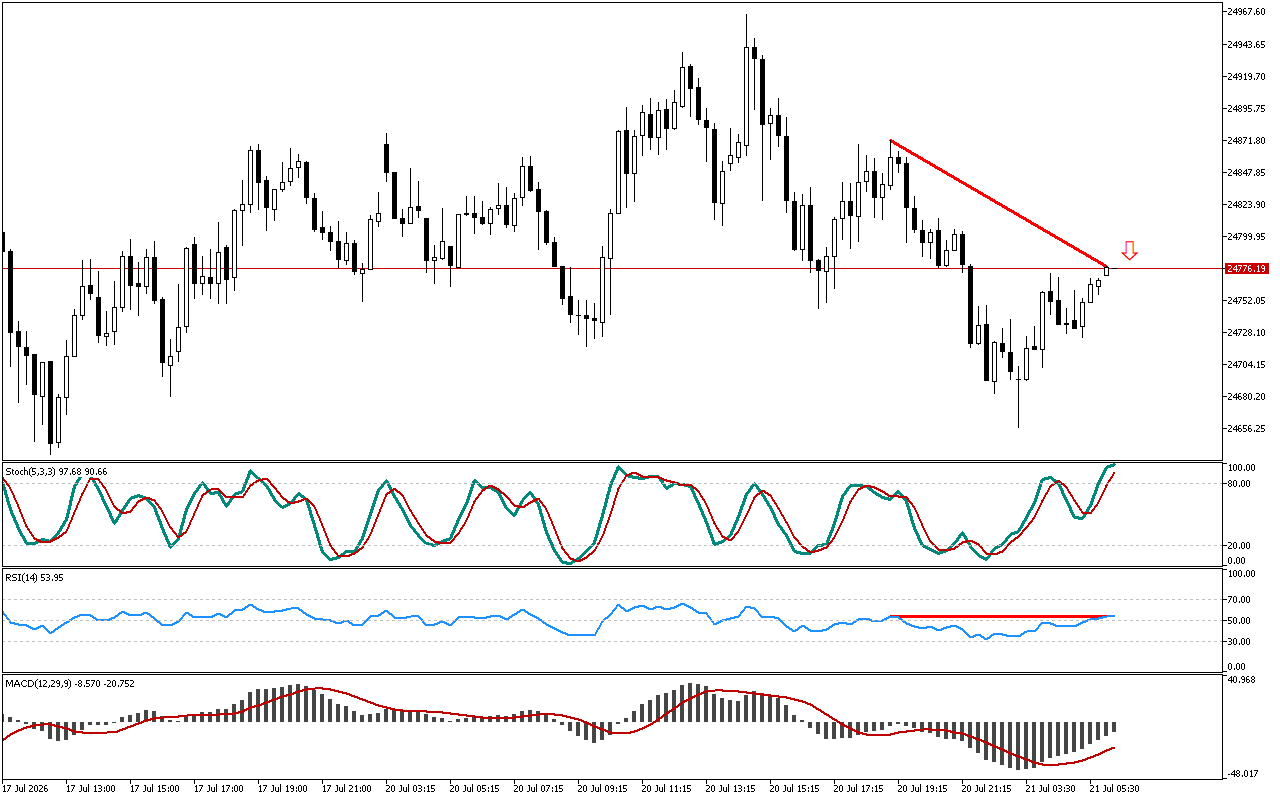
The price failed to reach a new low, while the RSI indicator shows an upward trend. The formed reverse divergence…
Read More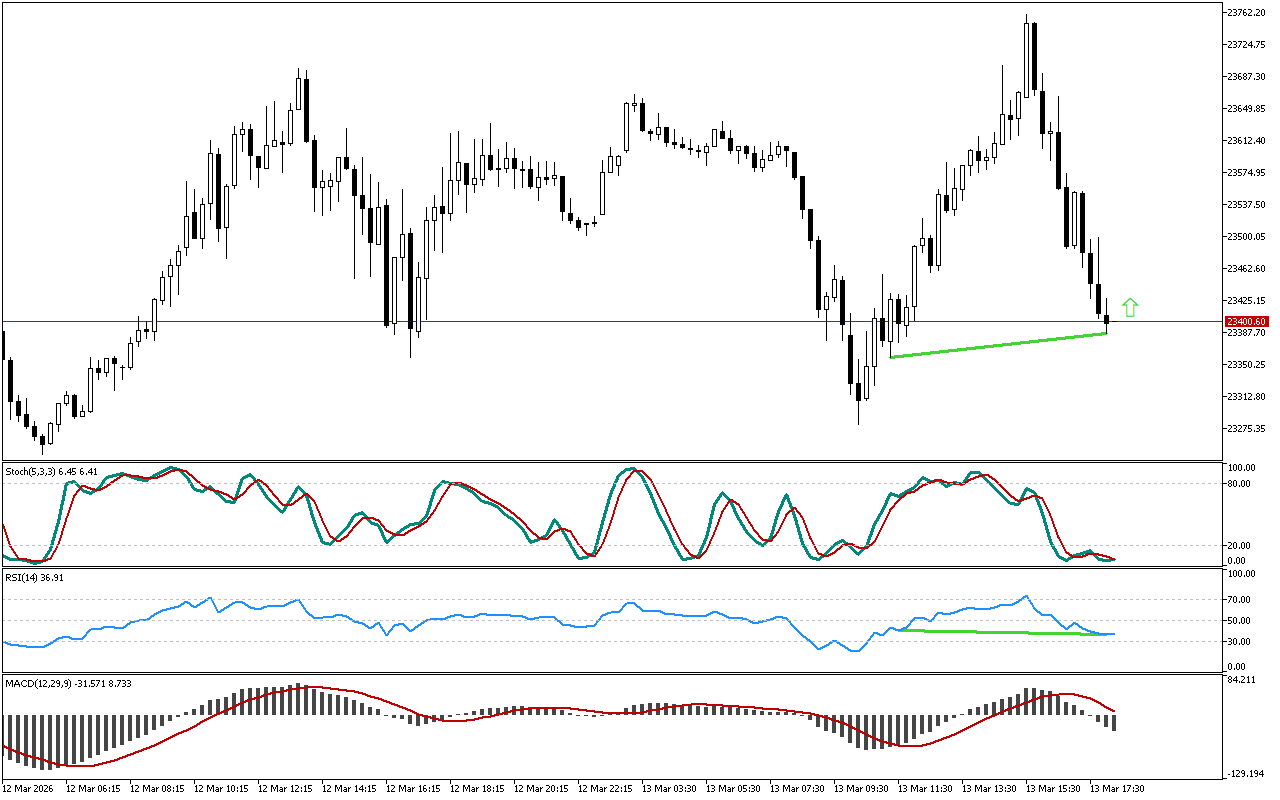
The price failed to reach a new low, while the RSI indicator shows an upward trend. The formed reverse divergence…
Read More