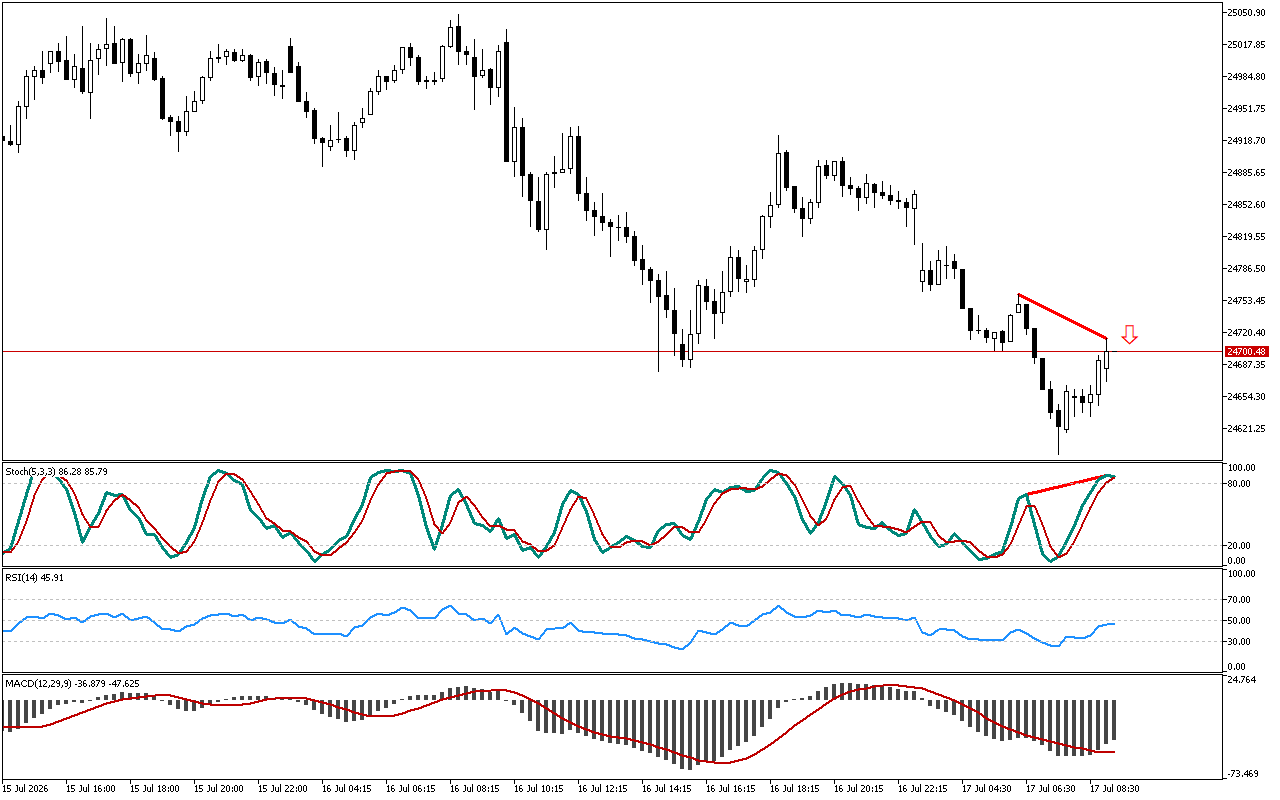
Let’s examine the Stochastic indicator. The oscillator shows the decay of the upward impulse along Natural Gas. The price chart…
Read More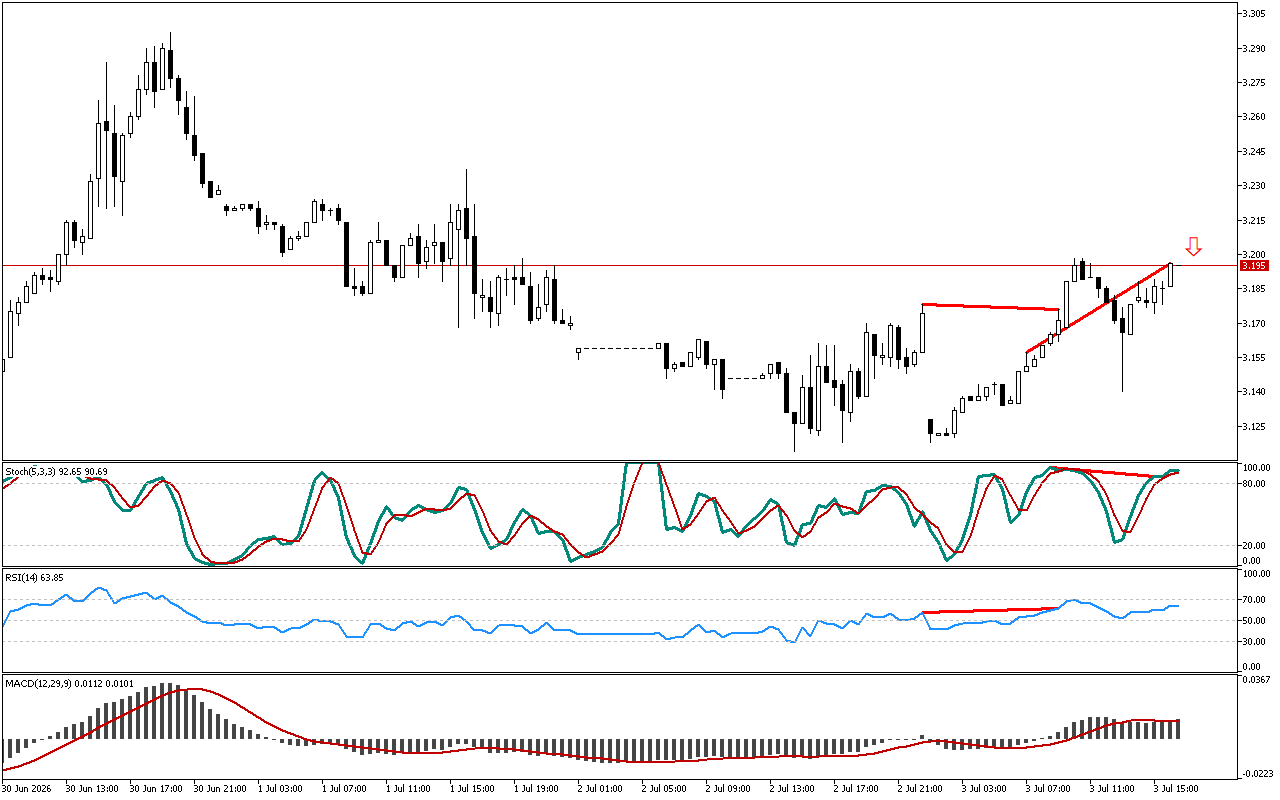

Let’s examine the Stochastic indicator. The oscillator shows the decay of the upward impulse along Natural Gas. The price chart…
Read More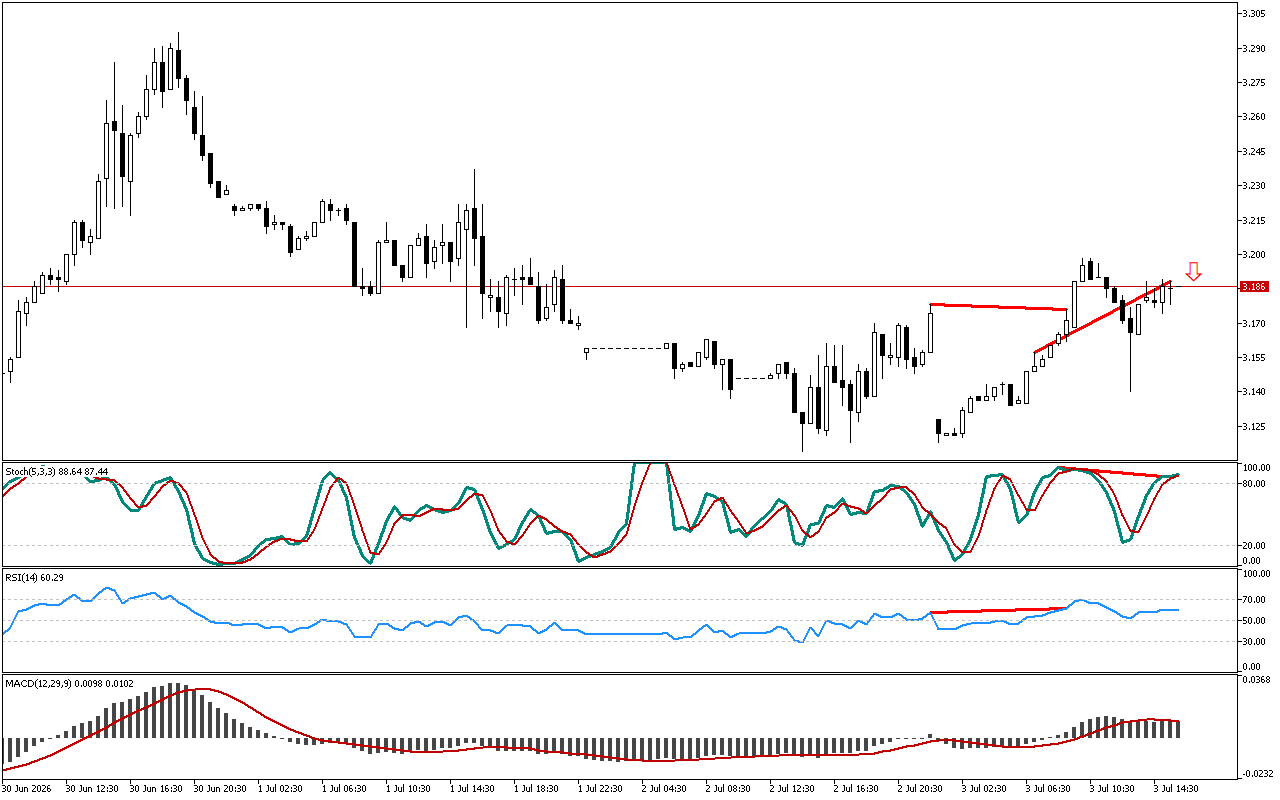
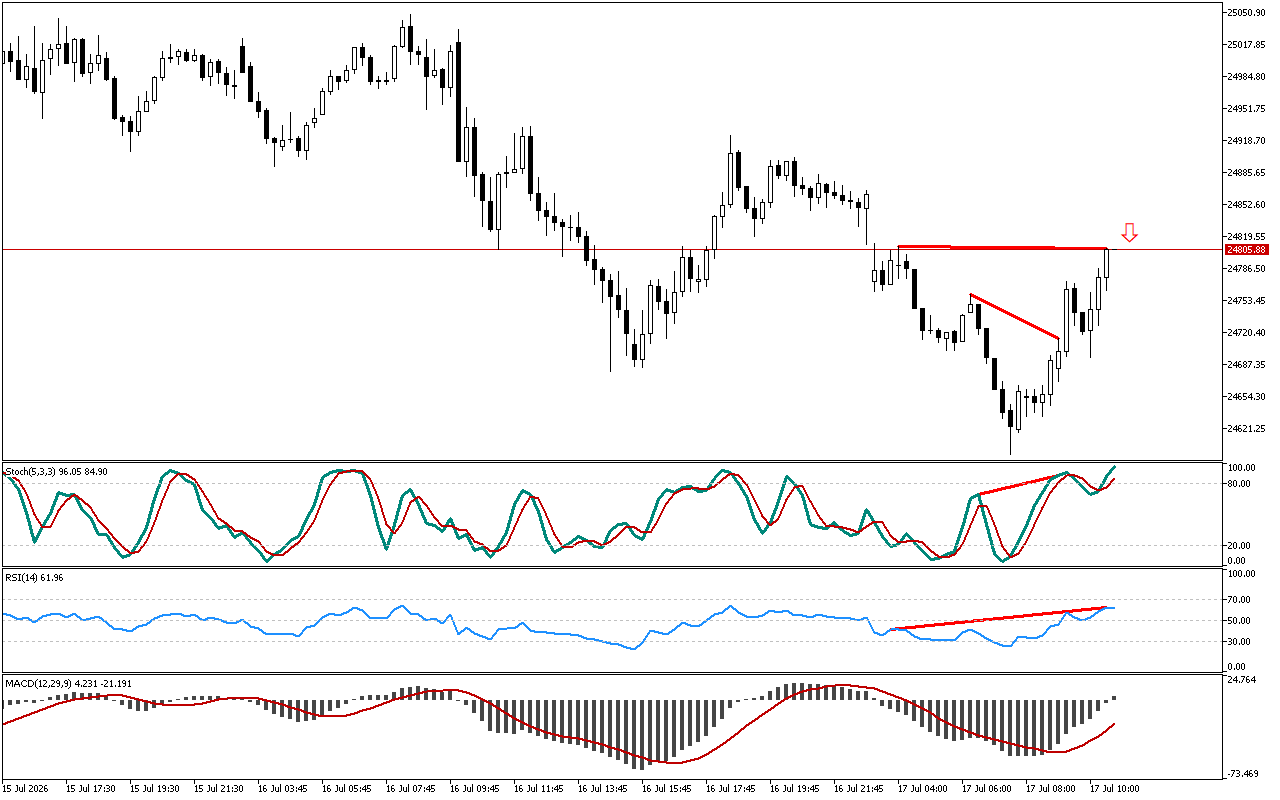
The price failed to form a new high, while the Stochastic indicator remains above the 20 level. This divergence, marked…
Read More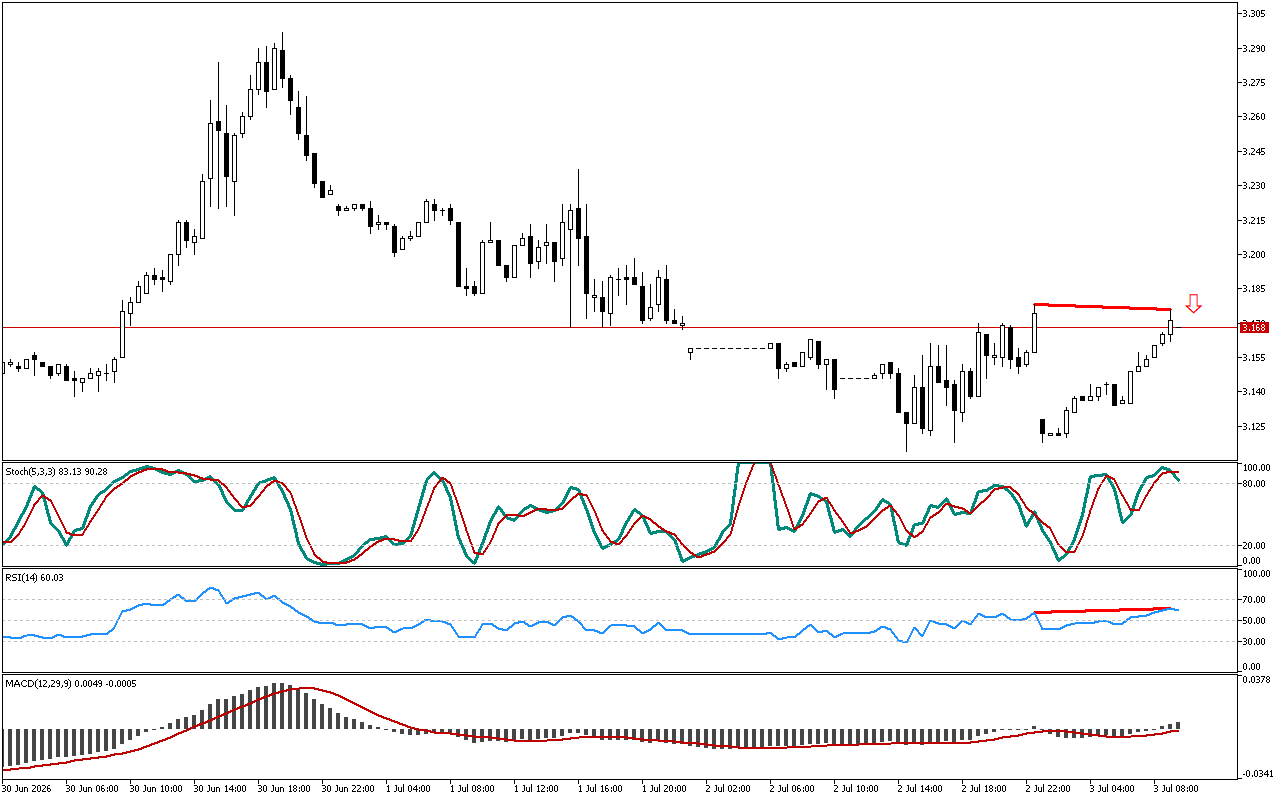
The RSI oscillator detects a discrepancy. The price failed to reach a new peak, while the RSI indicator rose above…
Read More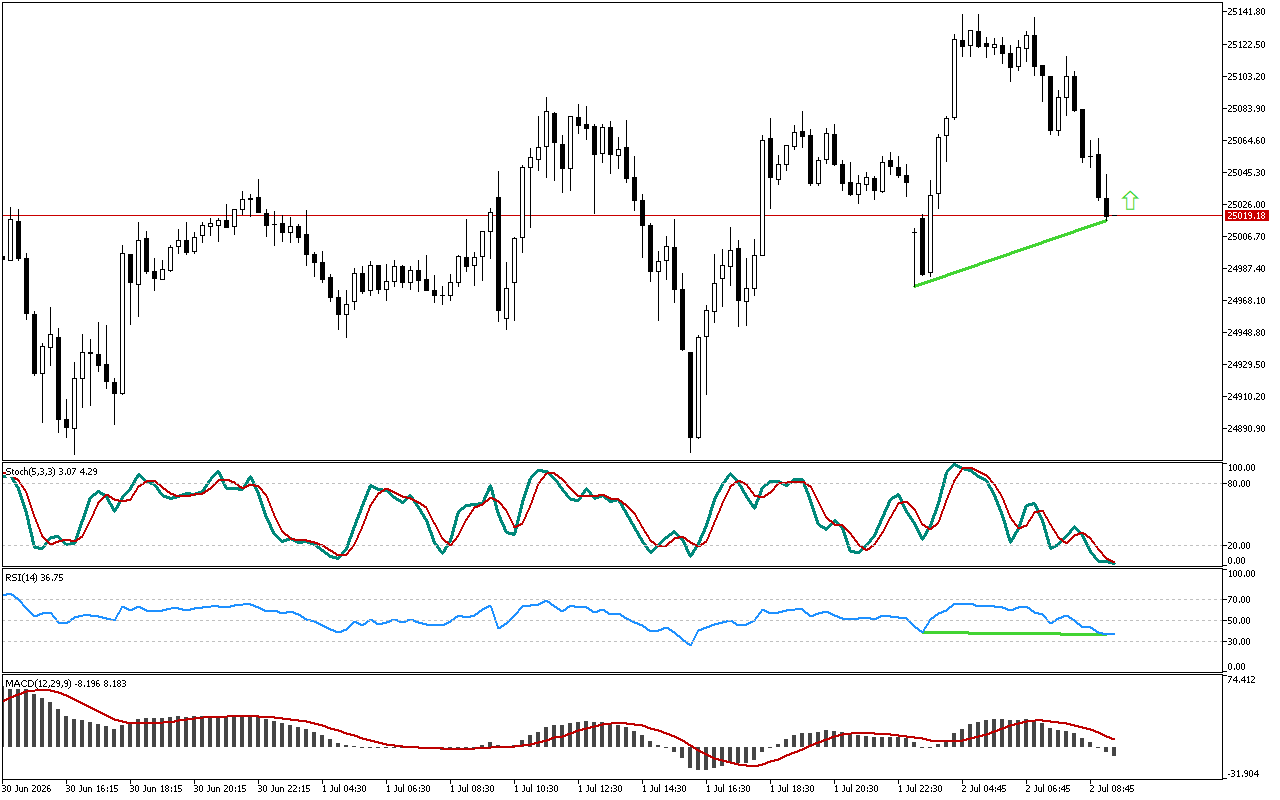
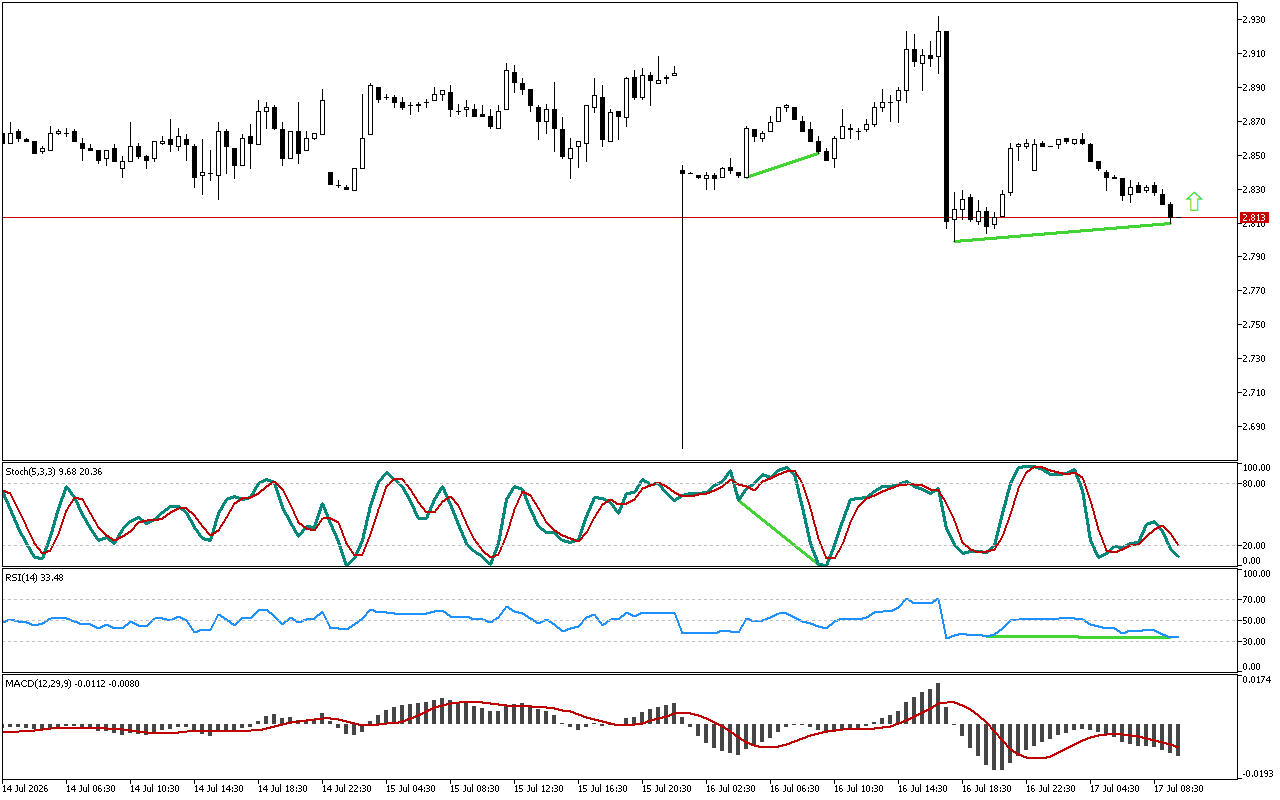
The price failed to reach a new low, while the RSI indicator shows an upward trend. The formed reverse divergence…
Read More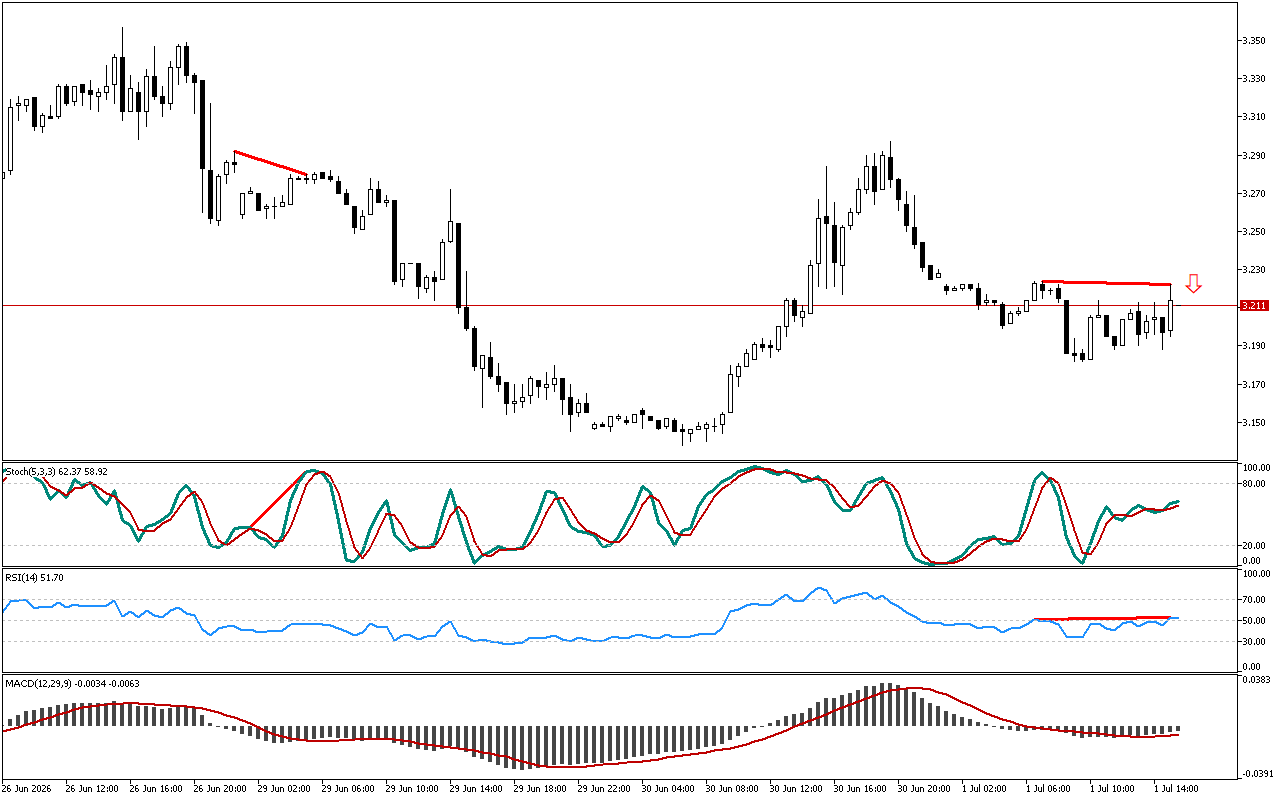
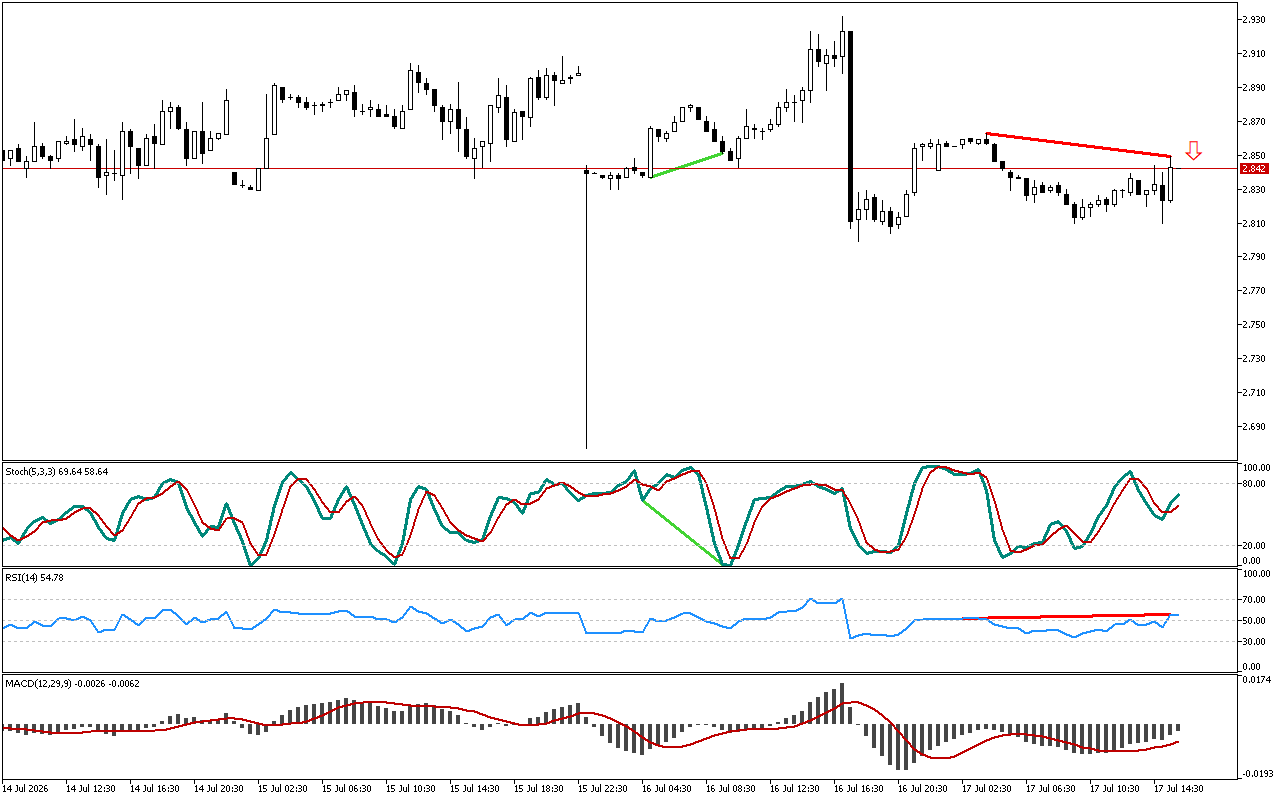
The RSI oscillator detects a discrepancy. The price failed to reach a new peak, while the RSI indicator rose above…
Read More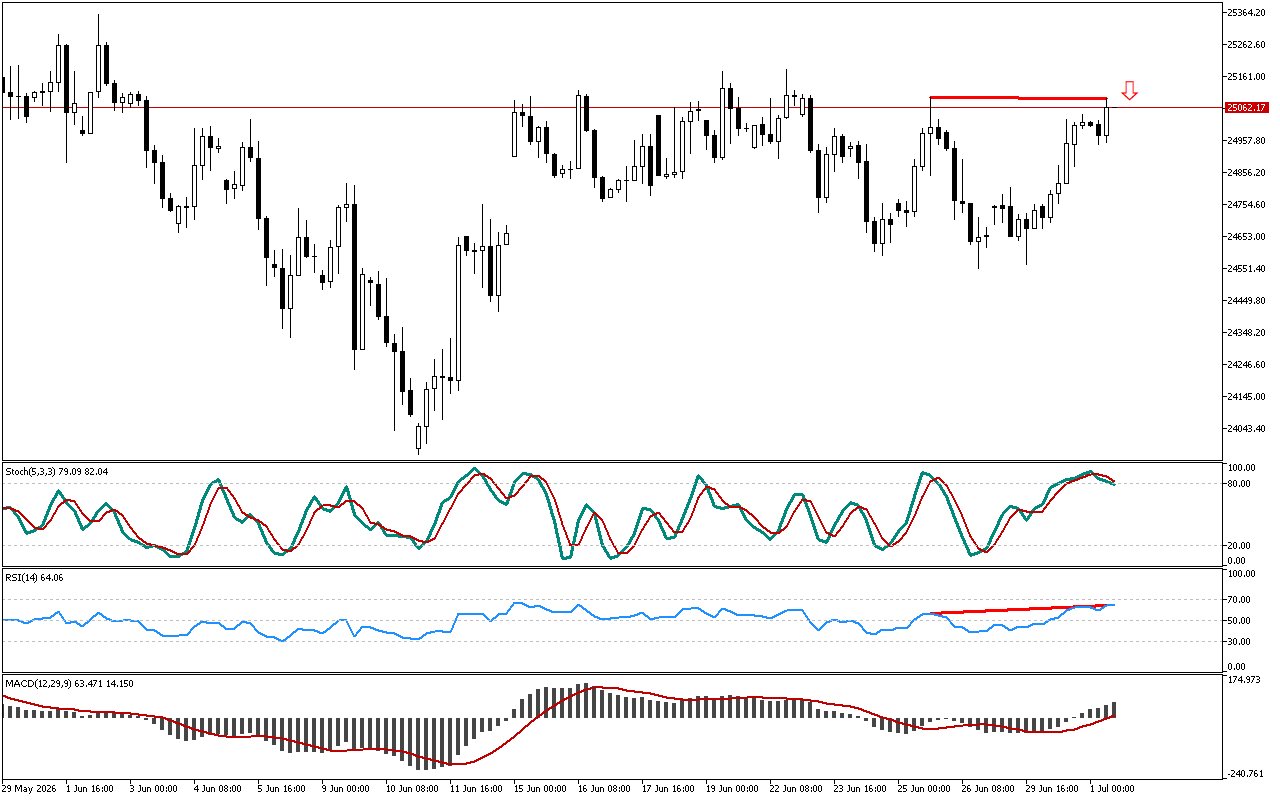
The RSI oscillator detects a discrepancy. The price failed to reach a new peak, while the RSI indicator rose above…
Read More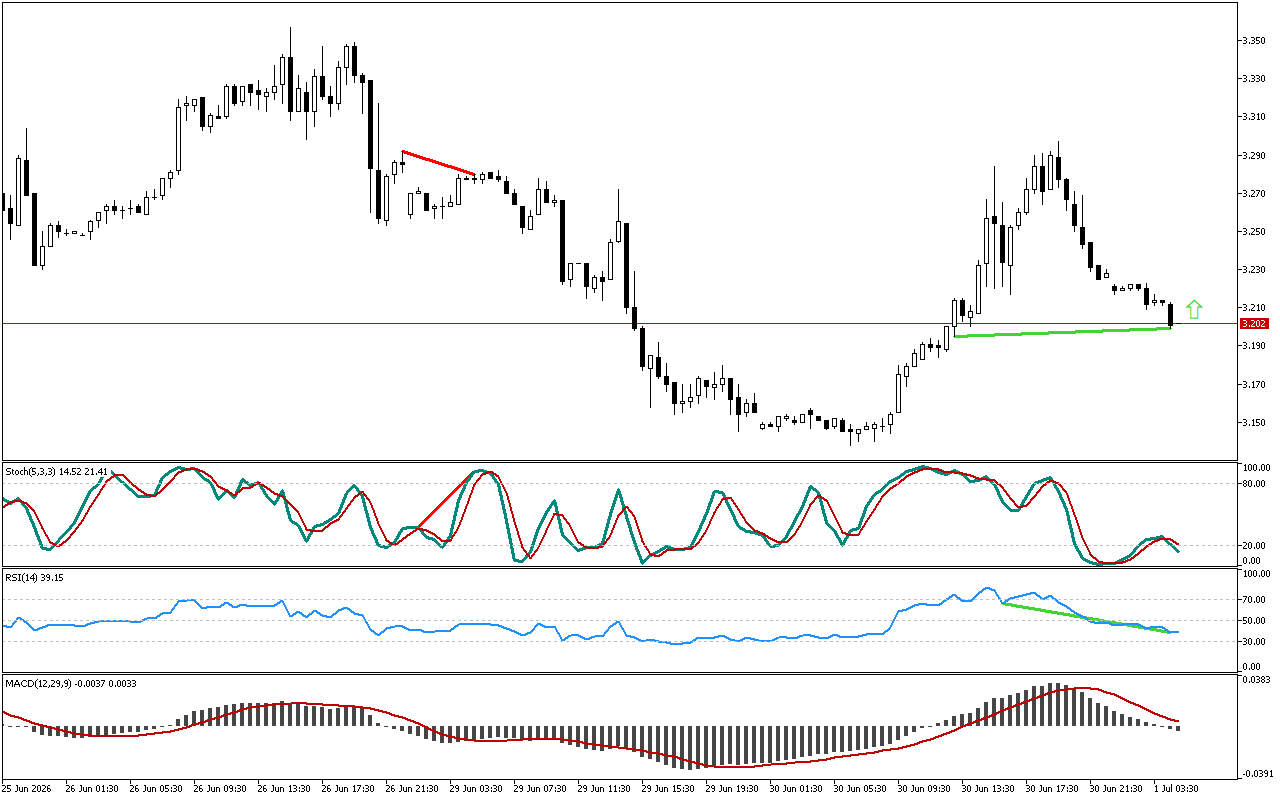
The price failed to reach a new low, while the RSI indicator shows an upward trend. The formed reverse divergence…
Read More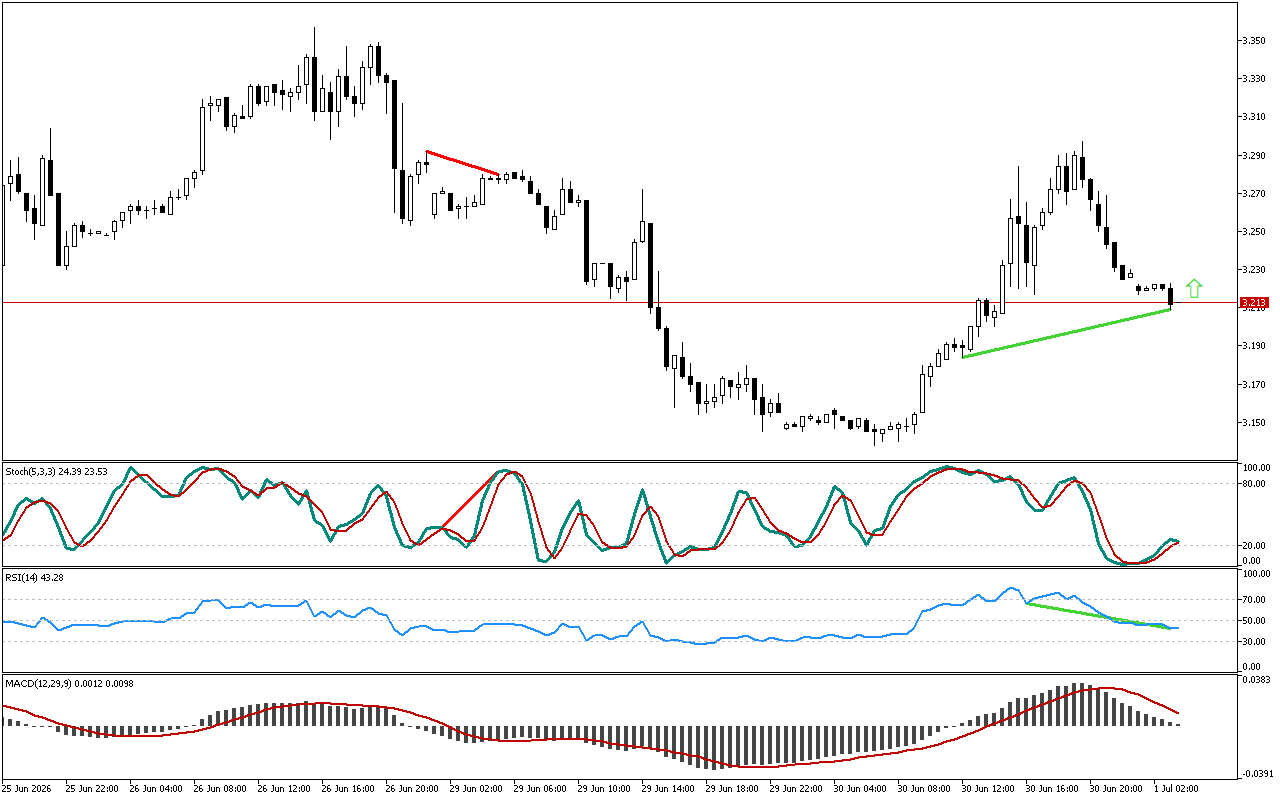
The price failed to reach a new low, while the RSI indicator shows an upward trend. The formed reverse divergence…
Read More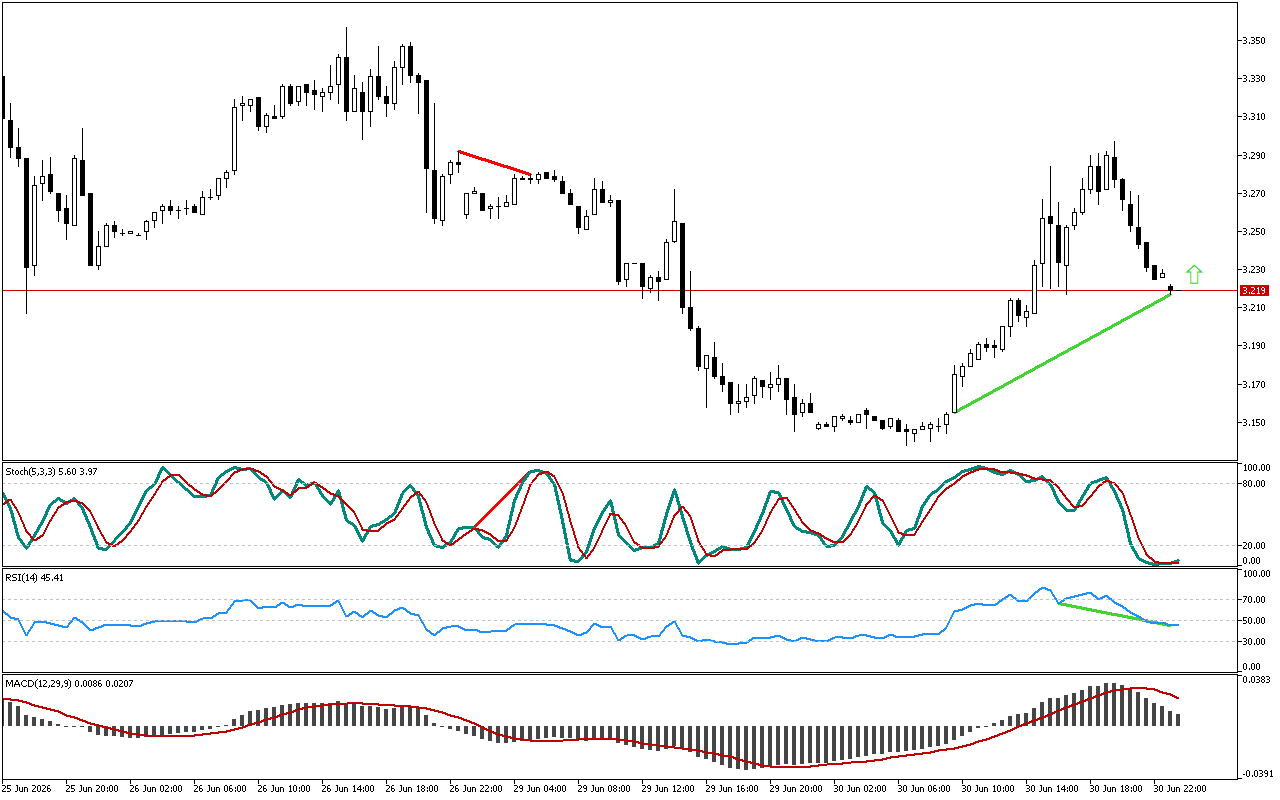
The price failed to reach a new low, while the RSI indicator shows an upward trend. The formed reverse divergence…
Read More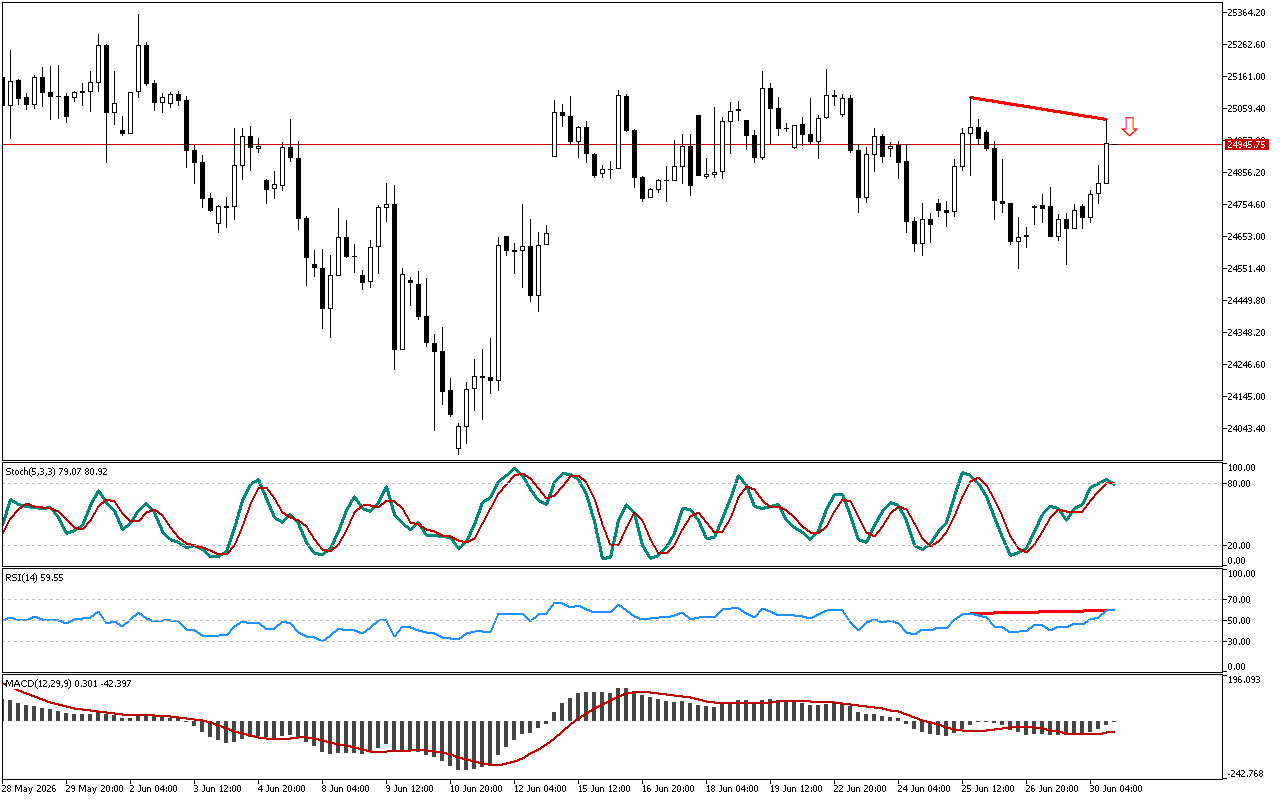
The RSI oscillator detects a discrepancy. The price failed to reach a new peak, while the RSI indicator rose above…
Read More