

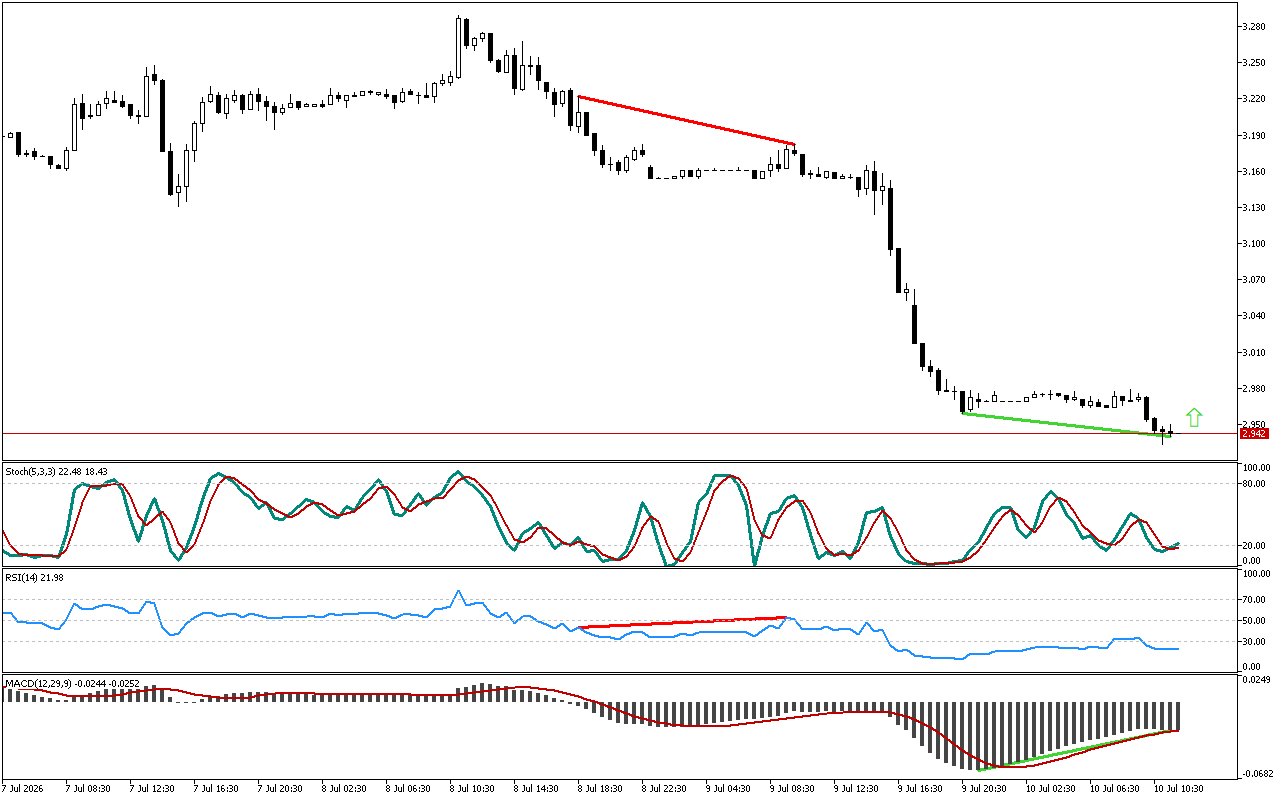
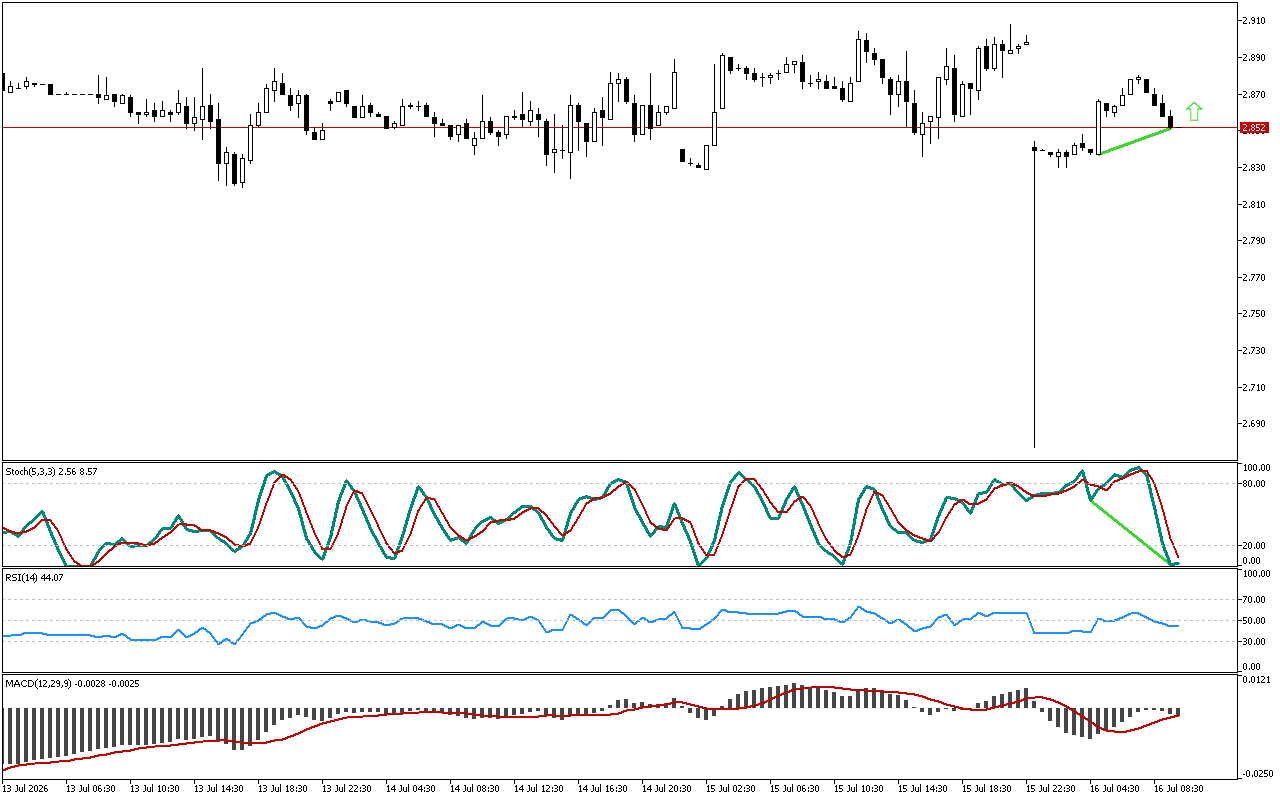
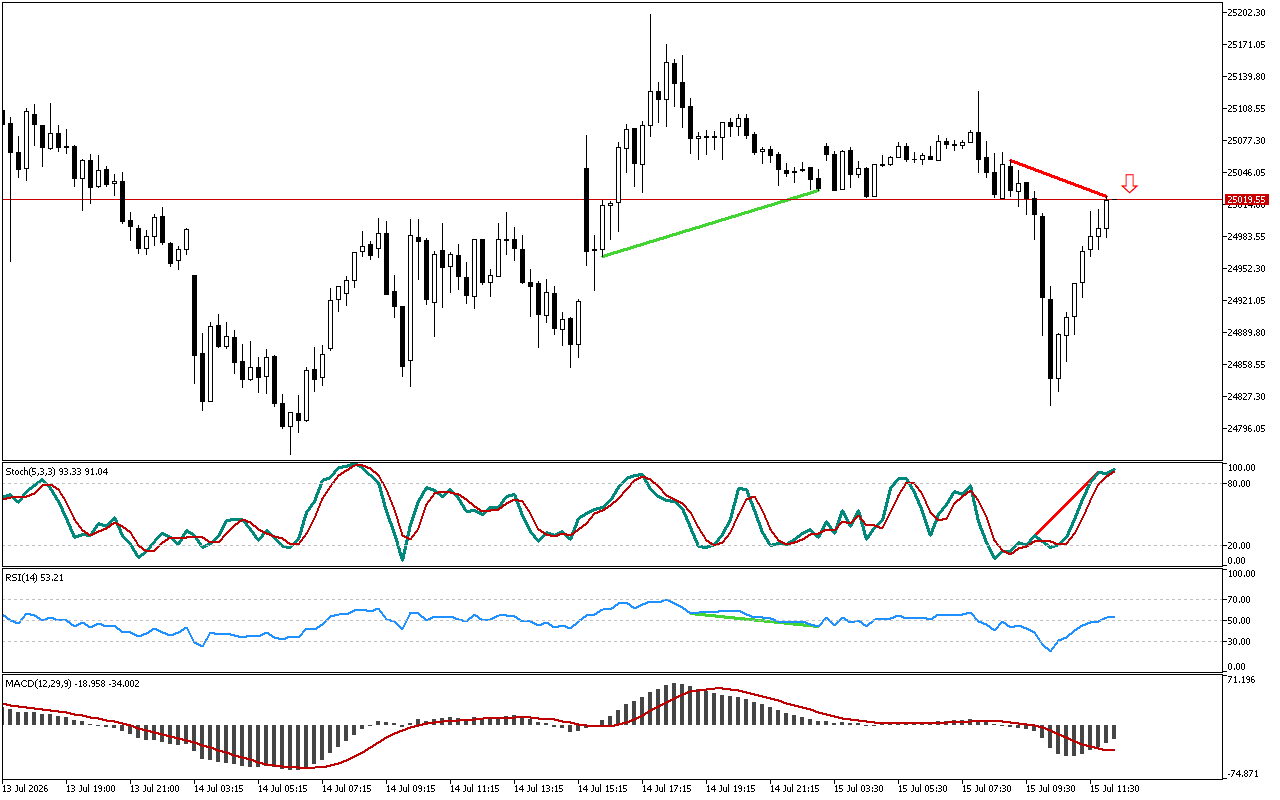
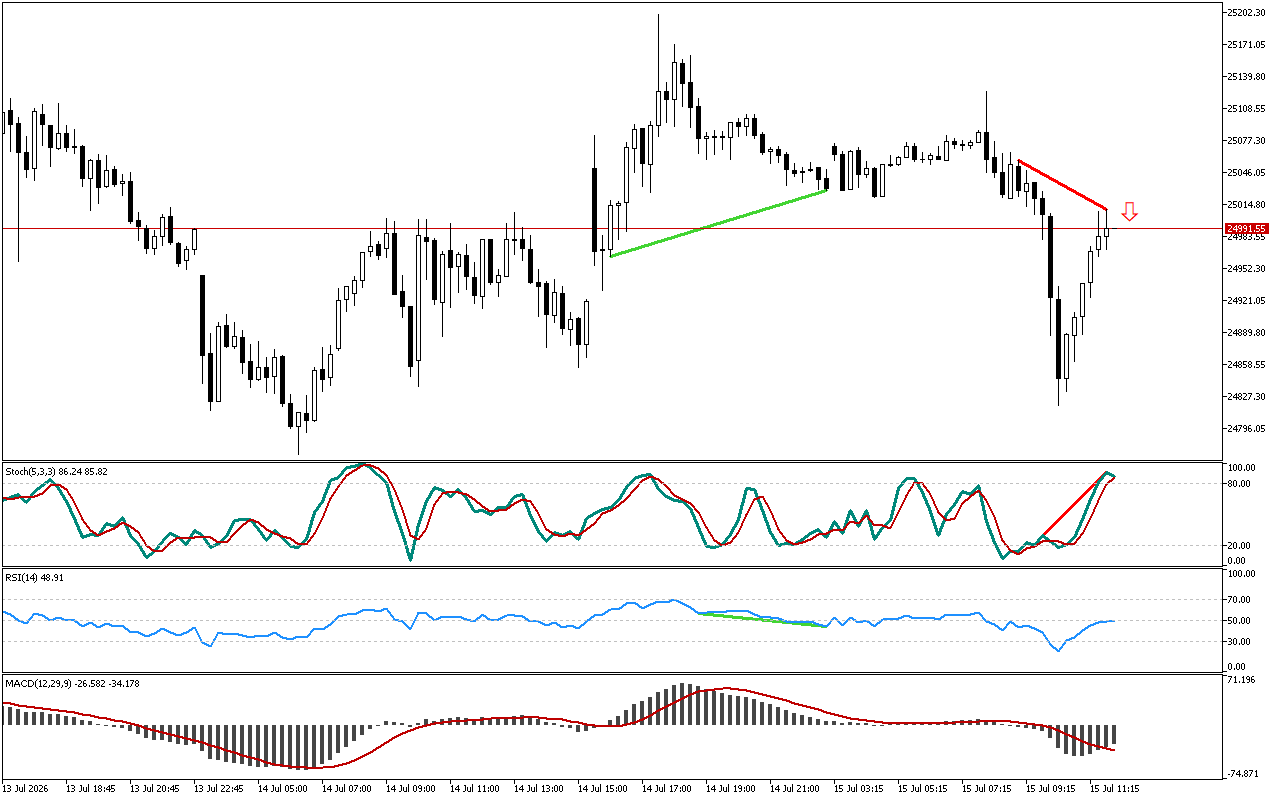
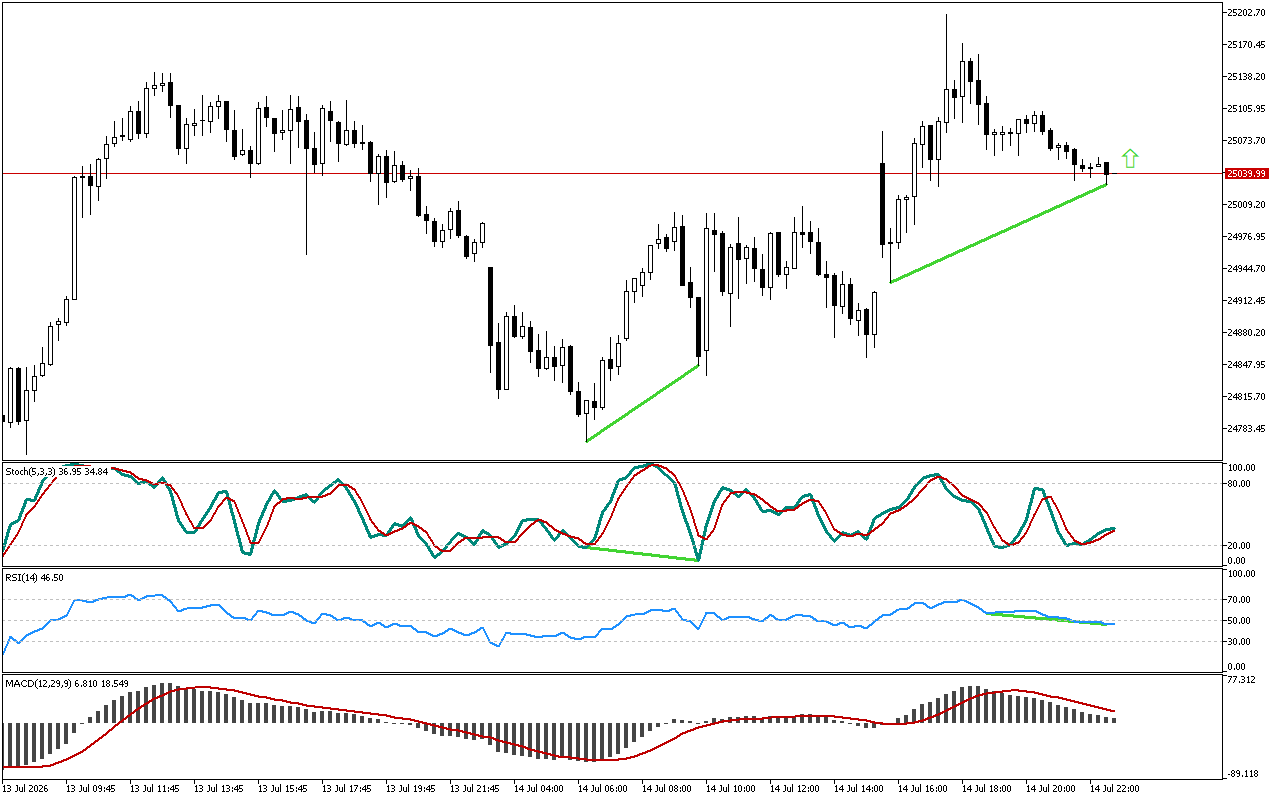
Let’s review the indications of the MACD. Despite the fact that Natural Gas maintains a downward trend, the MACD indicator has changed direction to an upward one. The reversal pattern is marked with a green line.
The RSI has dropped below 30. This is a signal that a downward movement is prevailing, but the indicator very rarely stays below 30 for a long time. Often after this there is a correction or a price reversal.
There is the blue main line above the red signal line on the Stochastic indicator. The reversal pattern has not formed yet.
The chart shows, that it might be strategically more profitable to open long positions in Natural Gas.
📌 Entry: 2.942
✔️ First target: 3.168
✔️ Second target: 3.295
❌ Stop order: 2.825
Natural Gas M30: An upward reversal signal was received from MACD
Leave a Reply