

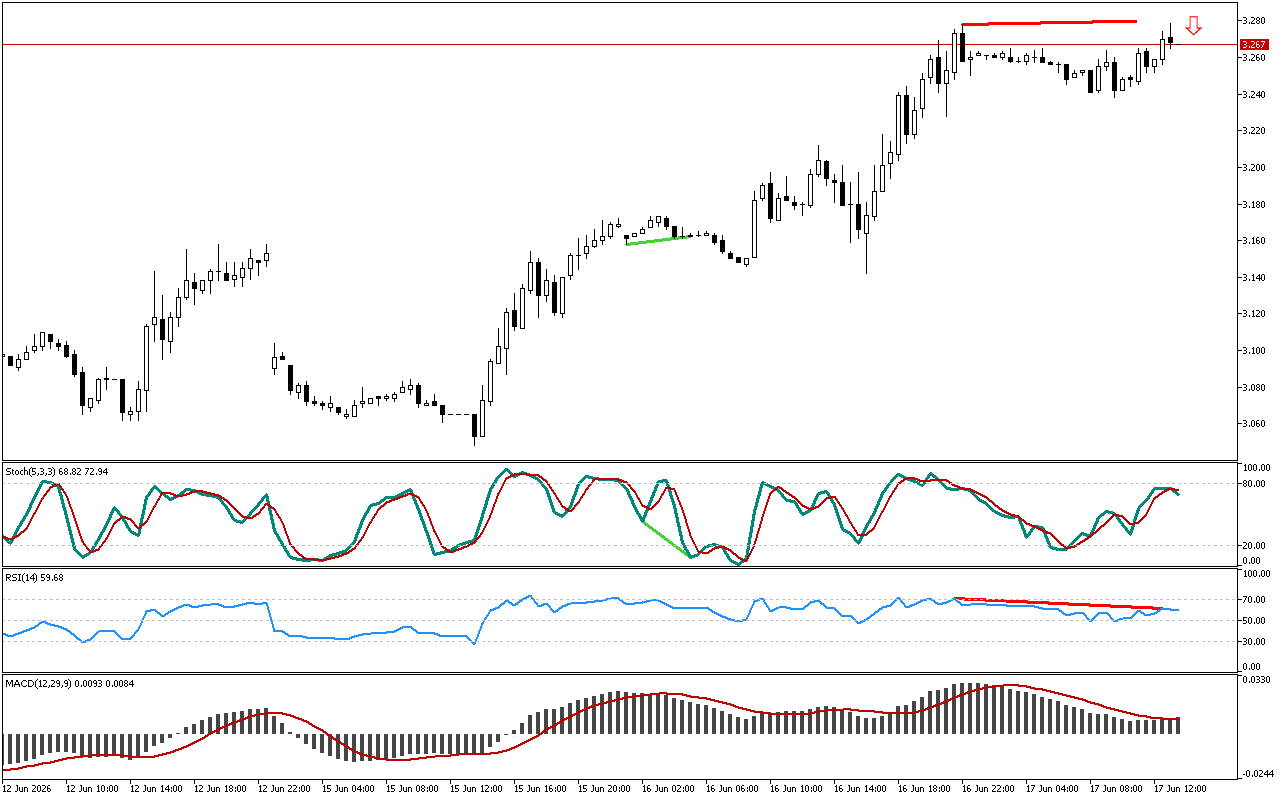
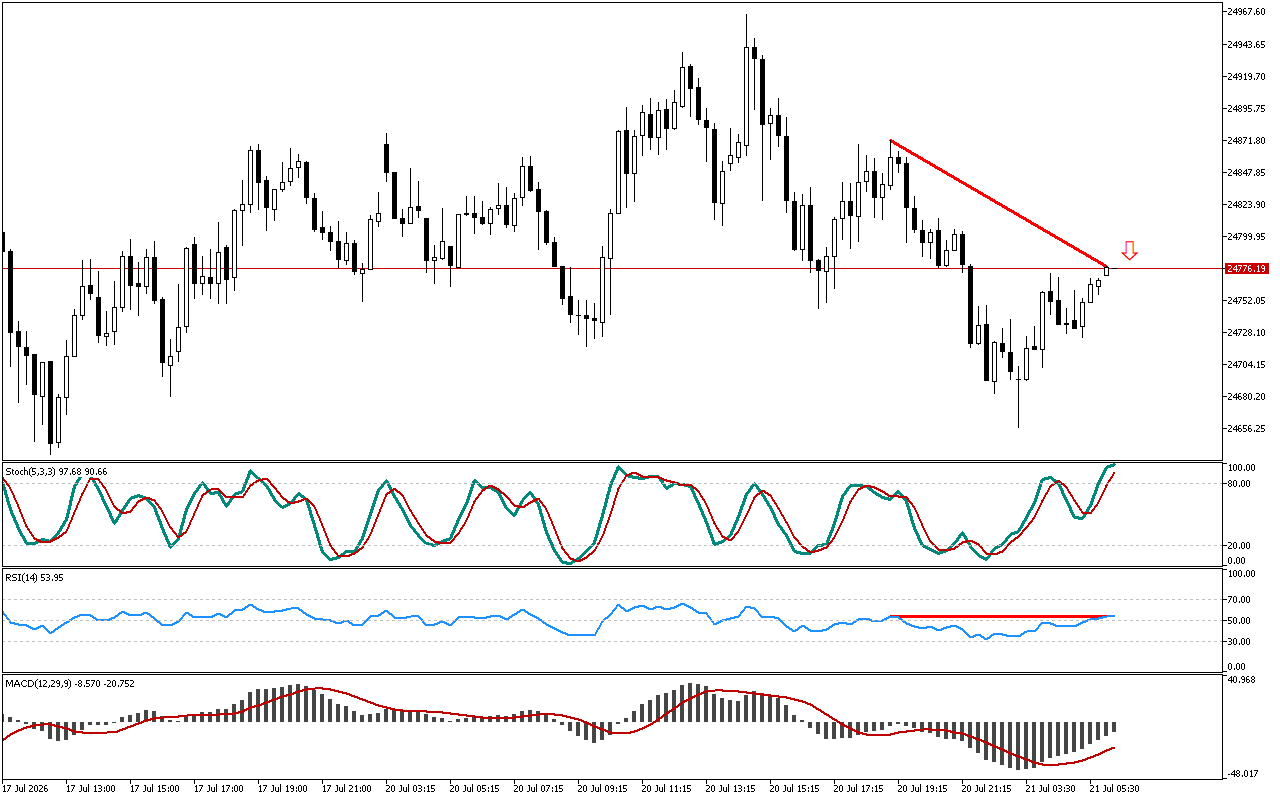
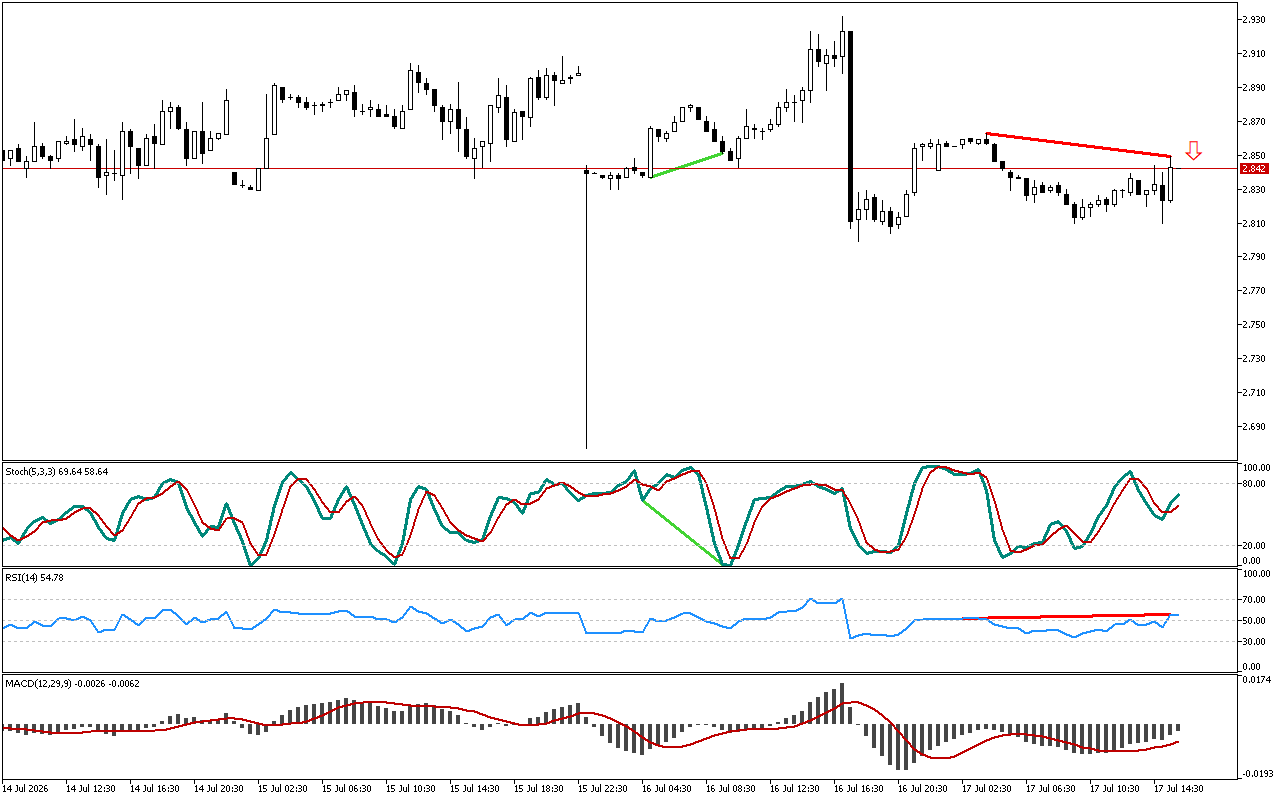
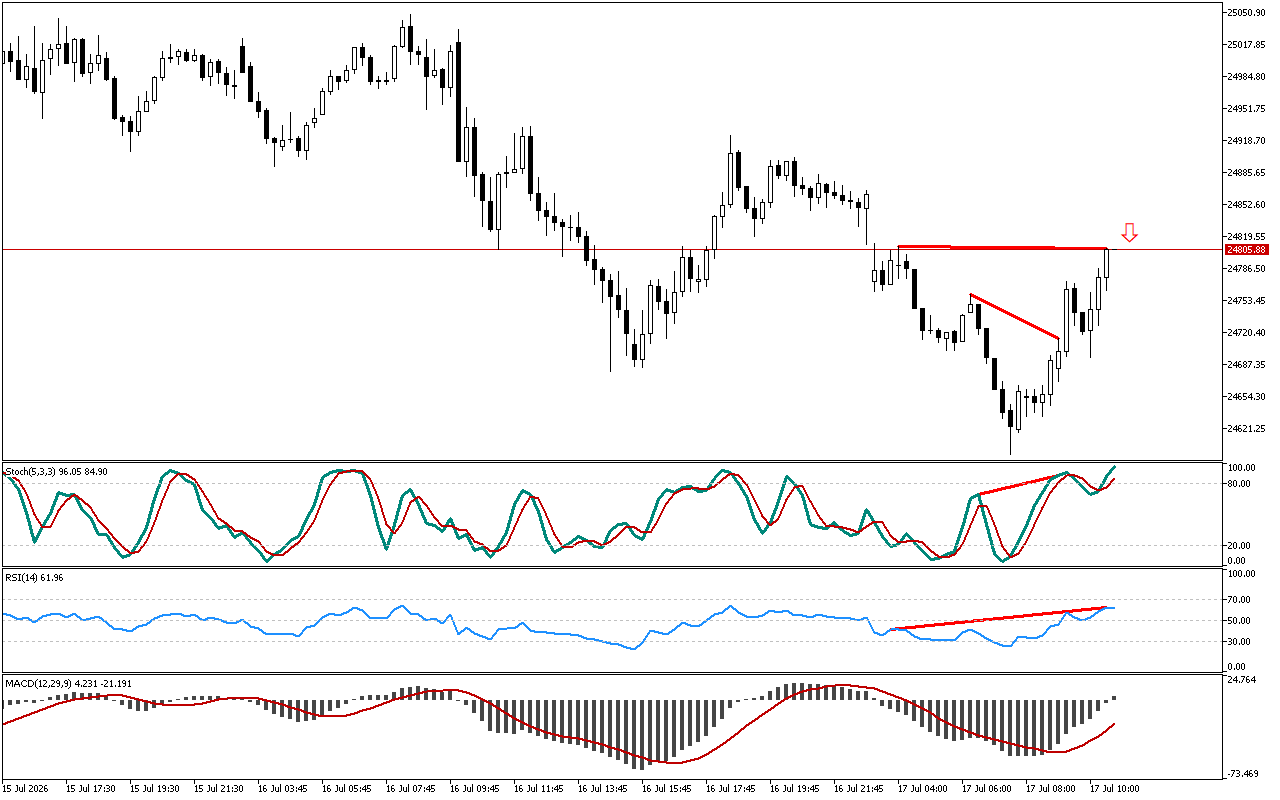
The price reached a new local high, but the RSI indicator could not confirm this growth, remaining below the level of 70. The formed divergence signals a potential reversal and a possible price decline in the near future.
The histogram of the MACD indicator remains above the signal line, indicating the local development of an upward movement. However, the indicator indications do not contradict the signal, marked on the chart.
On the Stochastic indicator, the blue main line remains below the signal red line. The current state of the indicator neither cancels nor contradicts signals received from other technical indicators.
Short positions in respect to Natural Gas look more warranted strategically. More conservative traders may consider entering upon a retest of this level. With a more aggressive strategy, a trader can enter at or around the current prices.
📌 Entry: 3.267
✔️ First target: 3.238
✔️ Second target: 3.205
❌ Stop order: 3.289
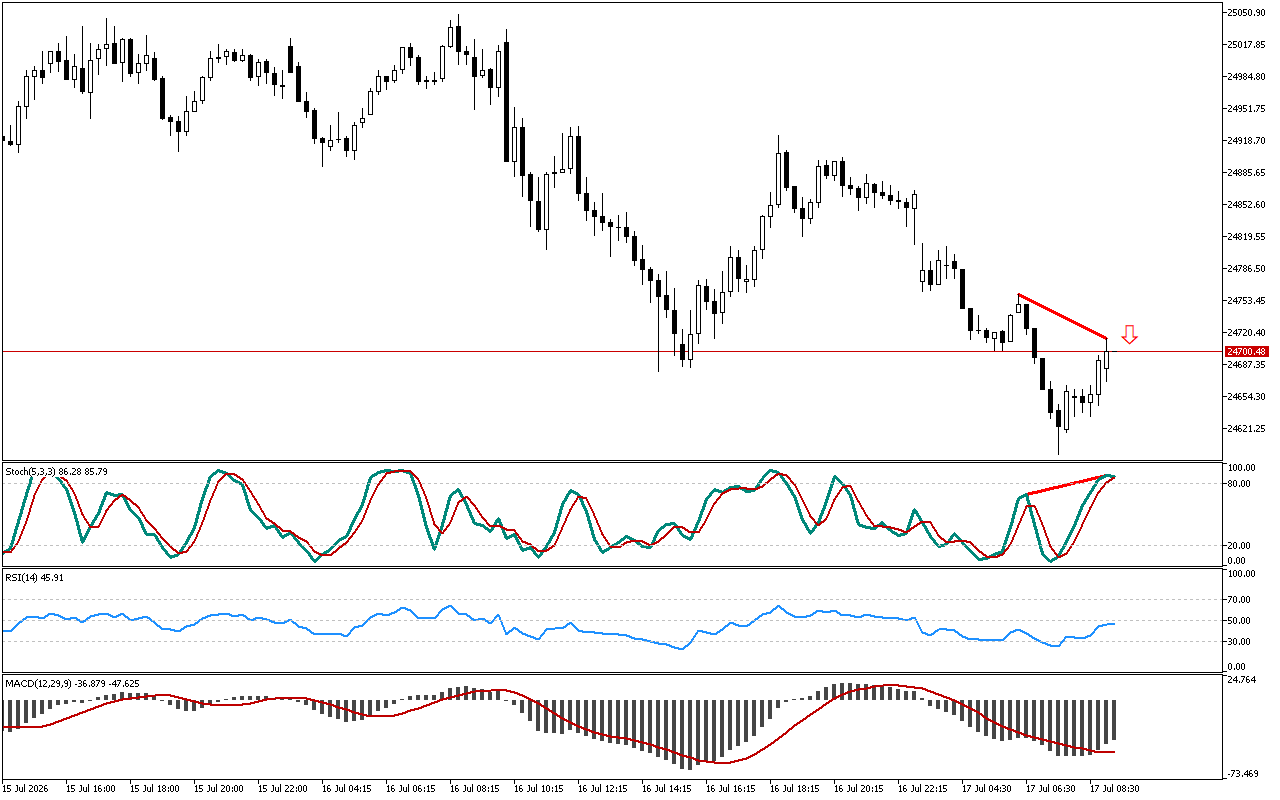
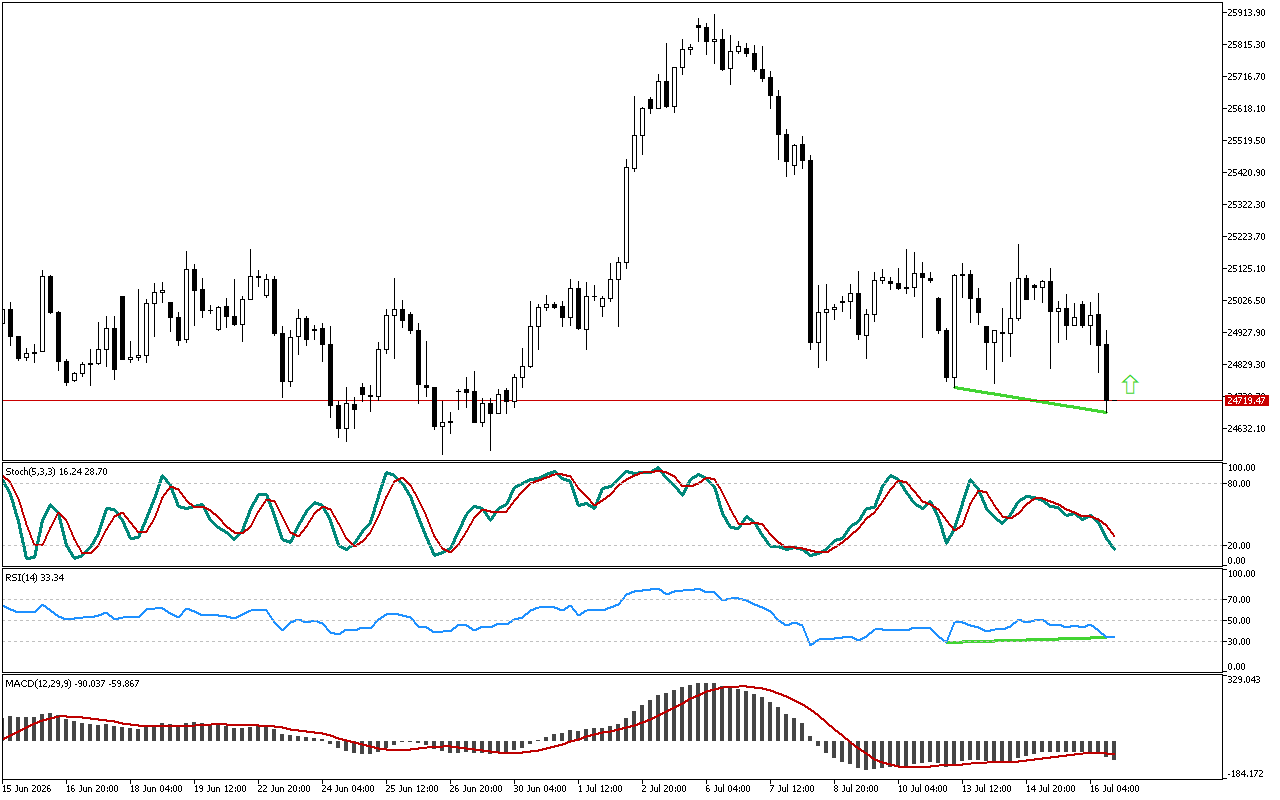
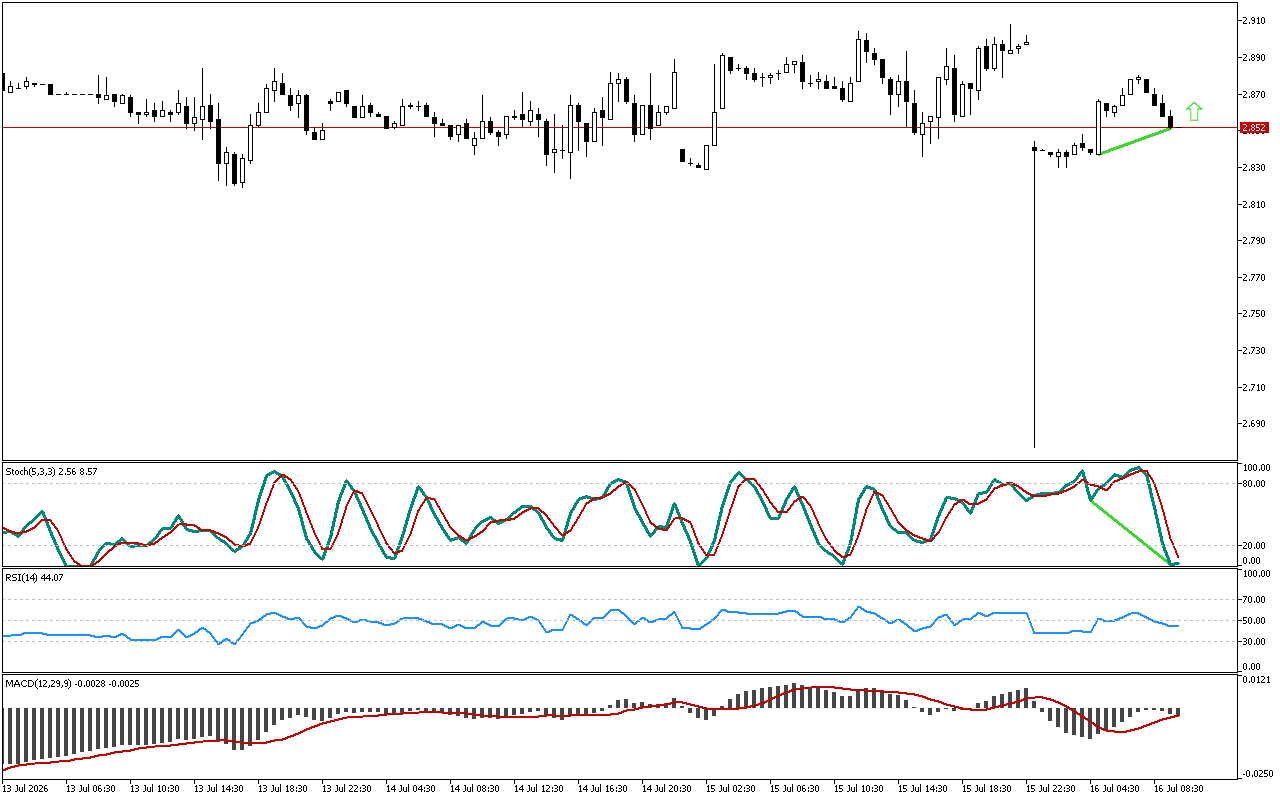
Natural Gas M30: The downward divergence from RSI
Leave a Reply